Download
1 / 1
10 likes | 122 Views
Houston et al., 2009 Figure S1. 3 WAF. 4 WAF. pI. A. 3.0. 4.0. 5.0. 6.0. 7.0. 8.0. 9.0. 10.0. kD. 2 WAF. 205. 116. 97. 84. 66. 55. 45. 36. 29. 24. 20. pI. B. 4.0. 5.0. 6.0. 7.0. kD. 5 WAF. 6 WAF. 205. 116. 97. 84. 66. 55. 45. 36. 29. 24. 20. 2 WAF.

E N D
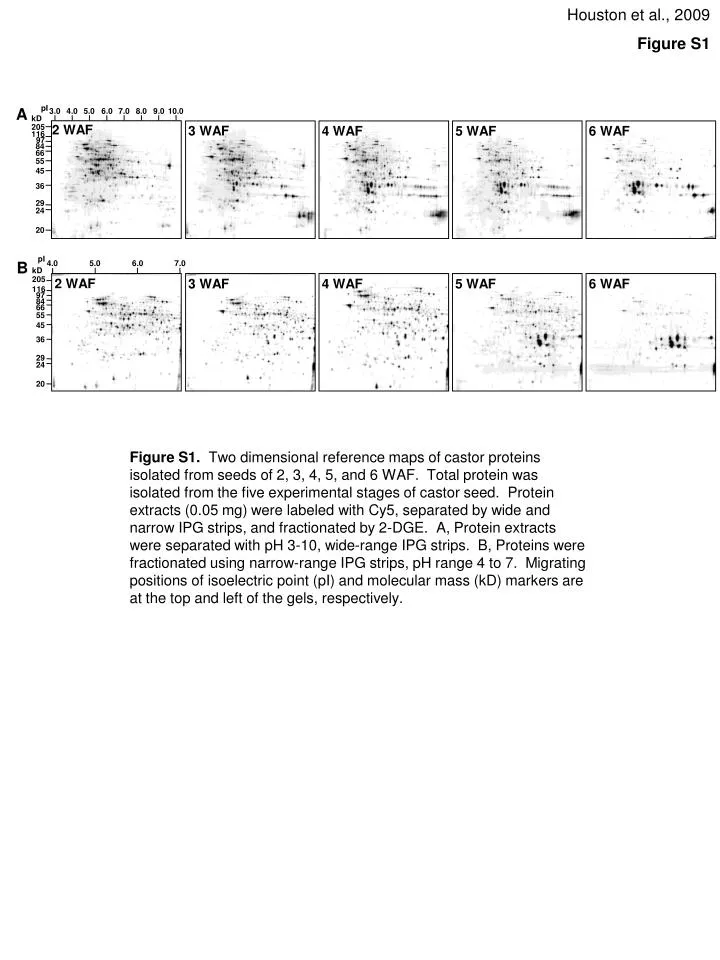
Houston et al., 2009 Figure S1 3 WAF 4 WAF pI A 3.0 4.0 5.0 6.0 7.0 8.0 9.0 10.0 kD 2 WAF 205 116 97 84 66 55 45 36 29 24 20 pI B 4.0 5.0 6.0 7.0 kD 5 WAF 6 WAF 205 116 97 84 66 55 45 36 29 24 20 2 WAF 3 WAF 4 WAF 5 WAF 6 WAF Figure S1. Two dimensional reference maps of castor proteins isolated from seeds of 2, 3, 4, 5, and 6 WAF. Total protein was isolated from the five experimental stages of castor seed. Protein extracts (0.05 mg) were labeled with Cy5, separated by wide and narrow IPG strips, and fractionated by 2-DGE. A, Protein extracts were separated with pH 3-10, wide-range IPG strips. B, Proteins were fractionated using narrow-range IPG strips, pH range 4 to 7. Migrating positions of isoelectric point (pI) and molecular mass (kD) markers are at the top and left of the gels, respectively.