Download
1 / 39
400 likes | 527 Views
THE SHIFT OF EARTH’S GEOMAGNETIC POLES AND CLIMATE VARIATIONS. V.A. Dergachev 1 , S.S. Vasiliev 1 , O.M. Raspopov 2 1 - Ioffe Physical-Technical Institute of RAS, St.Petersburg, Russia 2- SPbF IZMIRAN, St.Petersburg, Russia Moscow, 6 July 2012. ABSTRACT.

E N D
THE SHIFT OF EARTH’S GEOMAGNETIC POLES AND CLIMATE VARIATIONS V.A. Dergachev1, S.S. Vasiliev1, O.M. Raspopov2 1 - Ioffe Physical-Technical Institute of RAS, St.Petersburg, Russia 2- SPbF IZMIRAN, St.Petersburg, Russia Moscow, 6 July2012
ABSTRACT On a basis of palaeomagnetic data the analysis of the movement of Earth’s northern magnetic pole and change of its of movement rate for last 10 thousand years was carried out. Palaeomagnetic data from sediments in 30 lakes, which include the information on a direction and intensity of the Earth’s geomagnetic field have been used in this work. The empirical mode decomposition (EMD-method) method to the data on the change of geomagnetic pole position was used. The main point of this method is that the initial data are factorized on orthogonal components. It is shown that latitude as well as longitude are changed in time not stochastic, but have regular cyclic components. Change of the shift rate of the geomagnetic pole is investigated. For the purpose of establishment connection between climate change and movement rate of the geomagnetic pole the correlation analysis of accumulation rate of ice in Greenland and the change of position of geomagnetic poles has been carried out. There is an essential correlation between these data. The link between changes of geomagnetic pole position and climate variations on different duration time scales is investigated.
The next figure illustrates the scheme, which makes it possible to trace the relation of variations in SA, the geomagnetic field, and cosmic ray fluxes to climate changes. This scheme allows one to take into account the relation of total solar irradiance, solar ultraviolet, and cosmic ray fluxes to climatic and meteorological processes in the Earth’s atmosphere on short time scales.
Schematic interrelation between the variations in the cosmic ray intensity, SA, geomagnetic field, and climate changes Concentrations of cosmogenic nuclides observed in various archives on the Earth’s surface are determined by their production, atmospheric mixing, and deposition processes. We concentrate here only on the production processes, which depend on both the latitude and the altitude.
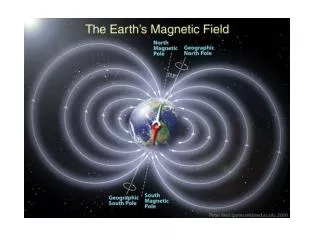
Direct measurements GF and change of the surface temperature of the Earth Actually regular measurements of the magnetic field of the Earth, as well as global temperature, have equally short time scale, all about 150 years, and the field intensity decreases with the lapse time. Magnetic poles test fluctuations from year to year. The magnetic field of the Earth influences speeds of carry of energy from the solar wind to the Earth’s atmosphere, and the movement of poles changes the geographic distribution of galactic and solar cosmic rays interacting with the Earth’s atmosphere.
POLE SHIFT LAST 150 YEARS 2010 2000 1960 1910 1860
North Magnetic Pole movement from 1600 Siberia RUSSIA Geographic NORTH Pole ARCTIC ocean Greenland 1600 2000 1700 CANADA 1900 1800
South magnetic pole movement from 1590to 2010 2010 2010 1910 1710 1590 1610
Recent evolution of the geomagnetic latitude (c) and longitude (d) from1840 to 2000
Sharp acceleration of the drift of magnetic poles of the Earth, since 1990 have not only catastrophic consequences for global climatic changes, but also testify to essential changes in power processes at the level of internal and external nucleus of the Earth, which is responsible for the generation of the magnetic field of our planet. Simultaneously with it, the decrease in intensity of the magnetic field of the Earth is observed. It is necessary to take into account and the fact of increase of the angle of polar “casps” spread in the magnetospherer. In the extended gaps the radiating material from the solar wind and interplanetary space has directed, that can results to changes in climatic parameters in polar caps. In particular, the drift of magnetic poles of the Earth and disclosing "casps" results not only in the increased penetration of fluxes of hard cosmic radiation to the surface of the Earth, but also to redistribution of temperature in its top layers. Such changes can result in redistribution of areas of origin of cyclones and anticyclones and, hence, to influence global climatic changes. This important factor is not taken into account at the estimation of influence of exogenous factors on global climatic changes.
3.Palaeomagnetic data from lake sediments and the analysis of the data on the time variation of latitude and a longitude of the northern geomagnetic pole for last 10 thousand years.
Determination of magnetic pole position from a magnetic field direction Site location is S(ls,Fs); site-mean magnetic field direction is Im, Dm; M is geocentric dipole that can account for the observed magnetic field direction; P is magnetic pole at lp,Fp; p is magnetic colatitude (angular distance from S to P ); North Pole is the north geographic pole; b is the difference in longitude between the magnetic pole and the site. P S M
Temporal and spatial variation of the geomagnetic field intensity (new data base GEOMAGIA).Dependence of latitude (Donandini, 2007) 0 4000 8000 12000 at the equator, Ba - at a particular magnetic latitude λ.
Estimation of the most probable position of pole latitude . Average calendar age is 200 years, number of the data points is 425, latitude is80.1 degree. 0 40 90 LATIDUDE, degree
Latitude of the geomagnetic pole calculated for 10 thousand year interval,by the maximum likelihood method. Axis X shows the calendar age of samples, Axis Y shows the pole latitude. Crosses mark the calculated values. 0 2000 4000 6000 8000 10000 12000 Date, years BP
Longitude of the geomagnetic pole calculated for 8 thousand years interval, by the maximum likelihood method. Axis X shows the calendar age of samples, Axis Y shows the pole longitude. Crosses mark the calculated values. The trend corresponding to the drift of the geomagnetic pole is obvious. 0 2000 4000 6000 8000 10000 Date, years BP
Empirical mode decomposition (EMD) method Changes of position of a geomagnetic pole (previous figures) at first sight are chaotic. Obtained dependences of latitude and a longitude on time have non-stationary character. Method EMD is used for the analysis of the data on the time variation of latitude and a longitude of the northern geomagnetic pole [Huang et al., 1998].The main point of this method is that the initial data are factorized on orthogonal components. The data on the changes of latitude and longitude contain a noise component. The cause of this noisiness is not clear, though its most part can be attributed to the measurement errors. Besides the change of latitude and longitude the long-term trends are evidently manifested. The trend in latitude is monotonously decreasing with increase of the samples age. The trend in longitude looks like the cyclic curve imposed on the monotonous curve. In general, the longitude trend corresponds to the known western drift of the northern geomagnetic pole. The other modes are the cyclic functions for which the Fourier spectra were calculated.
The EMD-analysis of data on change of the longitude of geomagnetic pole The trend is marked out by green colour; the last cyclic mode – by black colour. 0 2000 4000 6000 8000 10000 12000 Date, years BP
The EMD-analysis of the data on time variations of latitude of the geomagnetic pole. The trend is marked with green colour; the last cyclic mode – with black colour 0 2000 4000 6000 8000 10000 12000 Date, years BP
4.The accumulation rate of ice in Greenlandand changes of the longitude of geomagnetic pole
Accumulation rate of ice in Greenland during the last 10 thousand years The linear trend is marked with red colour. Axis X shows the age of samples in years. Axis Y shows the rate of accumulation (meter/year). 0 2000 4000 6000 8000 10000 Date, years BP
Periodogram of the data on the rate of accumulation of ice in Greenland during the last 10 thousand years 1300 yr Axis X shows the frequency (year-1), Axis Y shows the power of spectral lines (arbitrary units). 2000 yr 3500 yr
Change of a longitude of the NGP during the last 10 thousand years Linear trend is marked with red colour. Axis X shows the age of samples in years. Axis Y shows longitude, (western direction). 0 2000 4000 6000 8000 10000 Date, years BP
Cyclic modes Cyclic modes in the latitude (Table 1), in longitude (Table 2) and accumulation rate ice analysis (Table 3) longitude accumulate rate of ice 1300 1240 2000 2200 3500 3690 Similarity of harmonic components, presented in tables 2 and 3, indicate the possible connection of climate and of longitude of GMP.Correlation of the low-frequency components is established.
Comparison of periodograms speeds of the snow accumulation rate (the top panel) and variation of a longitude of a geomagnetic pole (the bottom panel). 7500 yr accumulation rate 3600 yr 2000yr 1300 yr Periofograms are similar over the long period (low frequency) domain. This fact is emphasized by the vertical arrows. longitude
Climatic anomaly in the vicinity of 8200 year BPand movement of the geomagnetic pole in vicinity of the temperature minimum
The 8200 yr BP cooling episode in North Atlantic region and a weakening of the Indian Ocean monsoon • It is a widespread opinion that a cold event occurred around 8200 cal BP was the strongest Holocene cooling episode with clear expressions in Greenland, the North Atlantic, Europe, North America, North Africa and the Venezuelan Cariaco Basin (see, e.g. Baldini et al. (2002) and the references in this paper). One of the proposed cause for this event is the catastrophic drainage of the large proglacial Laurentide lakes Agassiz and Ojibway into the Hudson Strait, including a very brief warming episode within the event (Renssen et al. 2001).
Oxygen-18 concentration (temperature proxy) measured in the ice core retrieved in Greenland Axis X shows the age of the sample, axis Y shows the relative concentration of 18O/16O in per mille. The arrow indicates the sharpdecrease of temperature which occurred 8,2 thousand years ago. 0 2000 4000 6000 8000 10000 Date, years BP
Change of latitude of the geomagnetic pole in a vicinity of 8200 year BP event 7600 7800 8000 8200 8400 Sharp decrease of pole latitude at 8200 year BP, stabilization of position and the subsequent restoration of latitude is evident.
The track of moving of a pole in a vicinity of 8200 year BP climatic event 8300 7900 8200 7900 8100 8000 Axis X shows longitude counted to the west, axis Y shows latitude.Figure shows that climatic cold event was preceded the fast pole displacement to the southwest.
The track of moving of a pole on the map of northern Atlantic At the moment of the great cold snap the pole was located near Laurentide ice sheet (glacier).
Rate of pole drift 7900 8000 8100 8200 8300 On vertical axis – the rate of pole drift. Great-circle arc degrees are used as unit.
SUMMARY 1. Approximately 8200 years ago northern geomagnetic pole, being located at northern Atlantic, has started to move quickly in the southwest direction. 2. As a result of the fast movement accompanied by fast climatic changes, has occurred acceleration of thawing of the Laurentide glacier in the North America. 3. Fast thawing has led to formation of a drainage channel to the Hudson Bay and emission of cold waters in the Labrador sea. 4. Great volume of water, V = 4.7 1014m3and low temperature has destabilised the Atlantic meridional overturning circulation, that has led to the time termination of inflow of heat in atmosphere and to onset of the global cold snap.
Conclusion We have considered and analyzed the paleomagnetic data on the lake sediments from 30 sources. These data present the measurements of magnetic declination and magnetic inclination of the core layers. Using the known declination and inclination and co-ordinates of site the position of magnetic pole was estimated as time function on the basis of the dipole model. Time dependences of latitude and longitude of the geomagnetic poles (GMP)are obtained for last 10 thousand years. The EMD-analysis of data on GMP position is executed. Intrinsic mode function (specific function of state) are obtained for these data. It is shown that both latitude and longitude vary not stochastic with time, but has regular cyclic components. The cyclic components of latitude have the average periods 1876, 2737 and 6185 years, and the cyclic components of longitude - 1240, 2200 and 3690 years. The trend of longitude corresponding to the drift is clearly observed. The rate of the drift is 3,24 degrees of longitude per century. Such a drift rate provides the full turn of GMP once per 11,1 thousand years.
Along with the drift there are slow deviations from the drift line on the average with the periods indicated above, i.e. GMP swinging takes place. The spectral analysis of the rate of accumulation (RА) of ice in Greenland has been carried out. It is shown, that the main cyclic components RA are similar in magnitude to the cyclic components of longitude (CL). Possibility of correlation between RA and CCL was considered. The obtained coefficient of correlation Kcor=0.4 is significant at confidential level 0.9995 (p=0.0005). The analysis performed has shown, that the correlation is provided, in general, by low-frequency harmonious components. The analysis showed that cyclic deviations of GMP from a trend line result in changes of amount of precipitations. Thus, connection of longitudinal movement of GMP and change of one of climate the indicators – the rate of accumulation of precipitations - is tracked. The variance of the ice accumulation rate, determined by slow changes of position of a pole, is Kcor2 =0.16.
Data on the sharp short-term change of temperature, which have occurred 8,2 thousand years ago, were analyzed. These data were compared to the change of latitude of GMP. It is shown, that sharp fall of latitude of a pole took place at t = 8200 yr BP. Such coincidence of displacement of the geomagnetic pole and the appearance of temperature minimum cannot appear by chance. It is shown that the climatic event (in 8200 year BP) was preceded by fast movement of a pole to the southwest. At the moment of the greatest cold snap a pole was located in a vicinity of the Laurentide ice sheet (glacier). Apparently, high rate of movement of GMP has caused onset of the period of a high solar insolation that result in the fast thawing of glacier and emission of great volumes of cold water to the northern Atlantic.