Download
1 / 40
400 likes | 543 Views
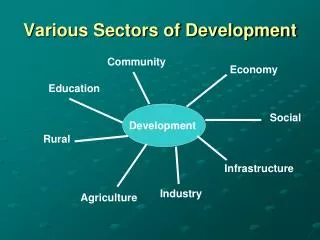
Development of Sectors. Prof. Dr. Sedef AKGUNGOR. Developments of Sectors. Traditionally, the sectoral division of the economy is based on a three sector approach, namely agriculture, industry and services . Each of these have their own subsectors .

E N D
Development of Sectors Prof. Dr. Sedef AKGUNGOR
Developments of Sectors • Traditionally, the sectoral division of the economy is based on a three sector approach, namely agriculture, industry and services. • Each of these have their own subsectors. • Agriculture has cereals and other crops or animal farming; industry has mining, manufacturing and energy; services have trade, banking, transportation, education and health. • This is called the classical division, in which sectors are seperated according to types of their value added.
Agriculture • Agriculture includes all types of land produce, plus animal husbandry and also forest and water products. • The primary factor of production of agriculture is land. • According to GCA 2001 (General Census of Agriculture 2001) , the total agricultural workforce is more than eight million. • One of the largest groups among agricultural workers is proprietors, i.e. those that work for themselves. • The largest group of workers in agriculture is called unpaid family workers.
One of the most important characteristics of agricultural employment is that unlike the economy as a whole and of course in all other sectors, the share of women in the work force is higher. • However, this high level of women participation is not supported qualitatively. • In terms of wage labour, daliy or seasonal labour, the position of women is much worse tham men’s. • The only superiority of women in agricultural work force is their numbers;in fact they are working as unpaid family workers and cannot be considered as real labourers.
Details of the Structure of the Agricultural Employment, 2010
The most important non-human factor of production af agriculture is land. • Thus, the land utilisation process and ownership should be taken as the basis for analysing developments in the sector. • According to GCA 2001, in 2001, more than 3 million agricultural enterprises were using 184.3 million decars of land. • In 1991, these figures were 4.07 million and 234.51 million respectively. • Thus the total amount of used agricultural land decreased between 1991 and 2001 by more than 50 million decares. • On the other hand , the number of enterprises also decreased by more than 25 per cent ,which is more than the amount of used land. • As a result, the average land per enterprise increased somehow from 57.6 decares to more than 61 decares.
For example, • In 1991, the smallest enterprises which were using less than 5 decares were 6,34 per cent of the total enterprises,while using only 0,28 per cent of total land. • In 2001, the smallest enterprises which were using less than 5 decares were 5,86 per cent of the total enterprises,while using only 0,26 per cent of total land.
Overall size distribution figures do not give any information about the natural aspects of land, such as its chemical and physical qualities, fertility, availability of water sources, weather conditions and location. • Infrastructural elements and investments are not considered as well. • There are two additional points that should be included in the analysis of the land. • One is how agricultural land is utilised, and the other is information about the ownership.
Inputs-Other than Land • The use of agricultural inputs other than land, such as machinery, irrigation, fertilisers and credits provides more information about the level of overall development as well as the productivity improvements in the sector. • For example, the use of tractors and other machinery played an important role historically in this regard. • It had increased more than 154 per cent from 16 to 42 thousand , between 1950-60.
During the planned 15 years from 1963 to 1977, the number of tractors increased more than 625 per cent to 370 thousand. • This rapid mechanisation of agriculture pushed agricultural labour outside the sector; to cities and even outside the country. • This migration process created manifold consequences , in both agriculture itself and in places where these people migrated. • The rate of increase of tractors was relatively slower during the 1980s and 1990s; 87 per cent and 36 per cent respectively. • The number of tractors reached more than one million in the 2000s. • Numbers of tractors can be considered as an important “direct” indicator of the trend of the mechanisation of the sector in general. • The use of all other inputs is facilitated by tractors.
Use of fertilizers also increased rapidly until the 1990s when it stabilised at around 10 million tons. • The same trend can be observed in irrigation , and more than a quarter of agricultural land is irrigated. • Agricultural credits also stabilised at around three billion TL during the 2000s. • This amounts to roughly 5-10 per cent of the ttal domestic credits supplied by the deposit banks.
Agricultural Incentıves-Disincentives • The policies of supporting agriculture can take two forms: direct and indirect • Indirect support can be taken to mean the infrastructure , which also includes the construction of roads, providing electricity, construction of irrigation facilities, silos and depots. • On the other hand, providing credits, setting minimum prices and practicing buying or purchasing guarantees constitute direct support. • Direct support was at its peak during the second half of the 1970s.
Even in the state monopoly cases, like tea leaves and tobacco , the amount of output was more than the capacity to process it. • Because of such shortcomings of the support, during the late 1970s and in some cases support meant total loss of resources. • Because of the change in the main economic policies of industrialisation, support purchases, reduced rapidly after 1980. • For some products, like tea leaves and tobacco processes the state monopoly was abolished around the mid 1980s. • Moreover almost all other support practices were gradually excluded from the support system. • The process of removing agricultural support was intensified by the World Bank and IMF-backed programs. • In 2000, input subsidies were substantially reduced and DIS (Direct Income Support) was put into practice.
There were some minimal but extremely diversified support practices around the end of the first decade of 2000s. • These included support purchases for some crops,as well as for tobacco, sugar beets and hazelnuts;in addition there were fertilizer subsidies,aand supports for all types of animal and animal products. • DIS set upper limits for the level of maximum output and paid for that. • Agricultural support policies change almost every year. • The total amount of agricultural support came about 2,8 per cent of GDP yearly between 2002-2007. • During 2006-2008, the total supports to agricultural producers were 21 per cent of the gross farm receipts.
Is Agriculture Stagnating? • Physical quantities of agricultural production, except tobacco and sugar beets, stabilised in the 2000s. • Agriculture as a sector approached a standstill with a share of around 10 per cent in the GDP. • And since the other sectors are growing more rapidly than agriculture share of agriculture in GDP is decreasing continuously. • There are several reasons for the agricultural stagnation that the country is passing through. • One of the most important reasons was the big shift of economic policy after 1980. • With more liberalised market conditions, the manufacturing sectors which were using agricultural outputs as their inputs started to import relatively cheaper ones. • Also in connection with incentives the DIS (direct income support) policy had a negative effect on agricultural production. • Moreover, there was market saturation for some products like hazelnuts, and probably sugar beets,tobacco and tea leaves at the beginning of the 2000s. • Finally, agriculture was losing its qualified labour power and capital sources almost continuously, not only because of general negligence of the sector but also the rent creation on the land in the big cities.
Industry: A Changed Track • “Industry” means all manufacturing plus the mining and energy , gas and water sectors. • Until 1980 industrialisation policies were characterised by the ISI (import substituting industrialisation) during the both Etatist and Planned Periods. • The ISI policies until the 1960s can be specified as the first stage of the ISI, i.e. domestic production of basic consumer goods,like food textiles and some intermediate goods such as cement,paper,iron and steel. • During the 1960s,planned period, came the second stage of the ISI, that is producing consumer durables,such as refrigerators, automobiles, washing machines and TV receivers.
During the implementation of the second ISI , it was stated that protection would be temporary; that is to say infant industry argument is used in designing the policies. • At that time the country had followed absolute protectionism. • That is if the quantity of domestic production of a commodity was enough for domestic demand then its import would be completely prohibited, irrespective of its price and quality. • With this approach, and with incentives and punishments as well, industrial establishments were required to use domestically produced inputs so far as they were available. • For some other commodities, relative protectionism, that is using devices such as customs duties and quotas was practiced. • It can be said that the second stage of the ISI, practiced for about two decades, created an industrial base.
Considering the industrialization policy there were some very important shortcomings of the ISI. • First, there were no policies to specify the concept of optimum size of the establishments. • Second, the cost of production was very high. • Moreover, almost all the former importers of consumer durables transformed themselves into producers within the ISI process. Each producer had a “mother company” which supplied not only more important parts produced domestically but also types of economic and technical support,including top management. This type of structure created some bottlenecks for further industrialisation later.
In 1980 the country witnssed shocking economic policy and political changes. • After 1980, there was no specific industrialisation policy except an export-led growth approach that treats all foreign currency generating sectors on an equal footing. • At the beginning of 1980, all the public industrial investment projects previously designed and partly implemented were cursorily put aside. • In addition, the PEEs(public economic enterprises) were put up for sale, i.e. privatisation. • These were the most decisive steps of completely withdrawing the public sector from manufacturing.
During the 1980s and 1990s, there was a gradual but continuous decrease in the role of the public industrial sectors in the economy. • It was presupposed that the PEE were useless or even harmful, because they were creating a burden on the state budget, sitorting free market principles and curtailing the development of private businesses by using capital resources. • They were producing expensively, and they had excess employment ,thus they had to be eliminated forever. • As the domestic market was opened more to the foreign products by reducing custom duties and eliminating other restrictions, industrial inputs were supplied via imports. • Thus the need for the public industrial establishments decreased considerably. • The government followed a policy stating that the sale of commodities of the PEE to private enterprises could not be below their cost.
In the development plans that were put forward after 1980 an export oriented and a more competitive industrial production structure was proposed. • Beyond this, the country had no defined industrialisation policy, including any specification of the leading or key industries. • In fact, industrialisation policies just before and after 1980 were rather like the two ends of a pendulum coming from one end and going to the other.
In addition, if technological changes are taken into account, Turkey missed an important opportunity during the 1980s and 1990s. • The Third Industrial Revolution was taking place with the unprecedented improvements in the ICT(information and communication technologies) during those years. • All the developed countries put more emphasis on science ,technology and education in a systemic manner by creating their NIS (national innovation systems). • Having no specific industrialisation policy in mind, Turkey missed this technological locomotive.
Structure of Manufacturing • The structure of manufacturing can be properly analysed either by using input-output tables or the statistical surveys and censuses which follow the value added approach. • One of the most important structural indicators is the size of the establishments. • According to the GCI(General Census of Industry and Establishments) 2002, the average size, that is the total number of the employed in the sector divided by the number of establishments, is 8,3 , which is very small. • That is to say per enterprise only alittle more than eight people are affiliated as employee and employer on average.
Manufacturinf sector has mostly small scale businesses or according to some definitions micro enterprises. • Because of the qualitative changes of the production structures ignited by Third Technological Revolution, the small scale production units have become more dominant in the industrially more advanced countries. • In the case of Turkey, the small scale is an outcome of being relatively less developed in terms of capital formation; the organisational and institutional formations and technological capabilities.
The size distribution of industrial enterprises is extremely uneven, that is they are cumulated within the 1-9 region which takes about 89.7 per cent of the total. • If the SMEs (small and medium sized enterprises) are considered, that is to say establishments less than 50 individuals, they approach 97.9 and those having less than 100 are equal to 98.9 per cent. • Thus, it can be concluded that Turkish manufacturing consists of only SMEs.
Manufacturing Sectors Having More than five per cent of Total Employment
However limited it may be, the data about the structure of manufacturing clearly shows that industrial establishments are small sized and they are concentrated essentially in the traditional sectors producing primarily consumer and intermediate commodities. • The structural characteristics of manufacturing have some negative and positive elements. • From the positive side these types of establishments, since they contain limited capital stock, are more flexiblein terms of adapting themselves to the conditions and working according to the special preferences of customers.
Howevet their small size does not permit them to become institutionalised, that is; the future of most small firms dependds on the owner-manager personally. • In addition, a small size sets limitations on the quantity and quality of the product, including product differentiation and the capacity to produce more at short notice,i.e. flexibility. • In addition being small will have relatively more limitations regarding technological and institutional innovation processes. • That is, conducting in R&D research and development activities and making institutional renovations which are related to the size is relatively difficult if not totally impossible, except that the SME is not an R&D enterprise itself. • These characteristics of the subsectors of manufacturing do not allow establishments to compete in international markets with a high technological edge.
Mining • During the implementation of more liberal economic policies the mining sector has been and still is a playground for private capital • There are some very important problems that the sector is facing . • First, the process of exploring natural resources and processing the products domestically before exporting is not well programmed and practiced. • That is to say the country’s natural resources are not fully utilised even in the case of boron and chromium, of which Turkey has a very high proportion of the world reserves and their quality is very high. • Second, there is a lack of institutional set up.
Energy • Traditionally the energy sector is considered to be in the public domain. • This approach changed completely after the 1980s and the place of private ownership increased in the sector. • Until 1980, the share of energy in GDP was less than one per cent; this increased to around two per cent during the 1980s, three per cent during the 1990s and more than foyr per cent during the 2000s. • Thus, it can be concluded that energy production increased faster than the growth of the toatl economy, and the sector gained strength in terms of production, transportation and internationalisation. • Capital formation in the sector had a similar trend.
SERVICES • Service sectors include all economic activities which are not included in agriculture and industry. • Service sectors can be considered as infrastructures of economic and social developments and well being, not only in the short term but in the long term as well. • Total services made upless than 50 per cent of total GDP until the 1980s. • This ratio had an increasing trend during the 1980s and 1990s. • By 200s it reached more than 60 per cent of GDP. • The same trend can be followed in constant capital investments.
There are three subsectors under services sector . • The first is the sectors directed to the improvement of human capital,namely education and health. • Thes econd is those sectors making economic activities more feasible, such as trade,financial services, transportation and communication. • The third group is all the others.
Education • One of the most important indicators of education is the number of students at each school level, which is called the schooling rate.
Health • Health services include not only illnesses and their cures but also sheltering, feeding, woring and environmental conditions. • Health is a very important aspect of human capital. • However in Turkey, even in 2010 , on average about 45 per cent of the labour force do not have any social security coverage according to the Labour Force Surveys, while in rural areas the rate is almost double.
Facilitating Services • Finance • Transportation • Conmmunication
Other Services • Trade • Housing • Tourism etc.
Public Services • After 1980, in addition to the decreasing role of the state, the Central Bank was made independent of government intervention in terms of its functions but not in its administration. • Furthermore, even basic public service like education and health were subject to privatisation. • The computerisation of information flows in public institutions is a new development of the late 1990s and 2000s and has been expending rapidly. • Governments are trying to create an “e-state”.