Download
1 / 31
310 likes | 407 Views
The Farm Security and Rural Investment Act of 2002. Ad Hoc World Outlook Conference May 16-17, 2002 Food and Agricultural Policy Research Institute FAPRI - University of Missouri http://www.fapri.missouri.edu. Agenda. A little background about the bill What’s in it? What does it mean?

E N D
The Farm Security and Rural Investment Act of 2002 Ad Hoc World Outlook Conference May 16-17, 2002 Food and Agricultural Policy Research Institute FAPRI - University of Missouri http://www.fapri.missouri.edu
Agenda • A little background about the bill • What’s in it? • What does it mean? • Market effects, or lack thereof
A Little Background: The Legislative Process • Work began in early 2001; got OK for $73.5 billion in new spending over 2002-2011 • House bill passed in October; Senate in February • Compromise conference report approved • 280-141 in the House (141-73 among Republicans; 137-68 among Democrats, plus 2 independents • 64-35 in Senate (43-7 among Democrats; 20-28 among Republicans, plus 1 independent) • Signed by President May 13
Major Features of the Bill • Sets farm programs for next 6 years • Creates counter-cyclical payment program • Numerous other program changes • About $4 billion/year in new spending • More money for conservation • Changes in food stamps, trade programs, research, rural development, energy…
Trade 1.5% Rural Dev. 1.2% Research 1.5% Energy 0.6% Forestry 0.1% Distribution of Additional Spending by Title (CBO Scoring)
Structure of New Program Target Price NOT Tied To Prodn Fixed Payment Counter-Cyclical Payment Loan Rate Loan Deficency Payment Req. Prodn
Establishes Target Prices • Used to determine counter-cyclical payments (CCPs) • CCP rate = Target Price – Fixed Payment – (higher of loan rate or season avg. farm price) • Paid on 85% of base acres • If producers do a full base update, then CCPs paid on updated program yield
Continues Fixed Payments • Not tied to current production • Paid on 85% of base acres, but base acres can be updated • Paid on program yields used for FAIR Act payments—no updates • Soybean payment yield: 78% of 1998-2001 yield
Effects of Fixed Payments • “Decoupled” from current production—don’t affect marginal revenue, so could argue shouldn’t affect production • Benefits capitalized into fixed assets (land) • Some argue “wealth effect” could result in more risky production • Base updating complicates issue
Maximum Counter Cyclical Pmnts • Depend on prices, but NOT production • Base area exactly the same as for fixed payments • Base yield updated to partially reflect improvements • Comment on yield update later
Effects of Counter-cyclical Payments • Like fixed payments, decoupled from current production (although tied to prices)—don’t affect marginal revenues • So benefits should also be capitalized • But may have wealth AND insurance effects that could result in more risky production • Base updating REALLY complicates issue
Allows Base/Yield Updating • Base Acreage--Producer options (up to size of farm): • Retain current AMTA base acres and add oilseed acres, OR • For all covered commodities, update base acres using average 1998-2001 acres planted and prevented planted • Payment Yields for CCPs: • Allows producers who update base acreage to the average of 1998-2001 plantings to update yields (for CCPs; NOT for fixed payments) • The update is the higher of 70% of the difference between current AMTA yields and a full yield update based on 1998-2001 yields on planted acreage OR 93.5% of 1998-2001 yields on planted acreage • Provides a “plug” of 75% of the county average yield for years in which the actual farm yield is less than the county average yield
Effects of Base Updating • If everyone believes this is a one-shot deal, effects on production may be small—affects wealth transfers, but not marginal incentives • BUT, if farmers think another update of base area and/or yields may occur in the future, farmers may produce more in order to increase future payments
Impacts on Crop Returns(Preliminary FAPRI estimates) • Additional payments increase the returns for all crops. • For this year’s crop, the increases range from 5% to 15% above the FAIR Act.
Impacts on Area Planted and Prices (Preliminary FAPRI estimates)
Crop Payments to Missouri (Preliminary FAPRI estimates) • Base and yield updating are important because • Producers can add soybeans acres and • Yields have been fairly good over the 1998-01 period.
Changes to the Dairy Program • Makes permanent $9.90/cwt Milk Price Support Program • Establishes a 3 1/2 year National Dairy Program • Federal payment each month equal to 45 percent of the difference between $16.94/cwt and the Boston Class I price. • Payments are made on up to 2.4 million pounds of production for a producer annually (Roughly 125 cows). • Revenue effects combination of payments and price declines • Structure of dairy industry determines how individual states will fare.
Payment Limitations • Limits per “person” of • $40,000 for direct payments; • $65,000 for counter-cyclical payments • $75,000 for loan deficiency payments (LDPs) and marketing loan gains • Separate limits for peanuts, conservation, and other programs • Retains current rules on spouses, 3-entities, the actively engaged requirement, and generic certificates • Adopts a $2.5 million adjusted gross income cap on eligibility for participation in farm programs • Creates a new commission to study and make recommendations regarding farm program payment limitations
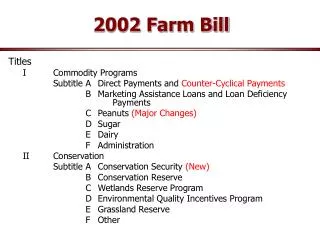
Conservation Programs • Adds $17.1 billion to conservation spending, including • Conservation Reserve Program – Increases cap from 36.4 million acres to 39.2 million acres. • Wetlands Reserve Program – Increases cap to 2.275 million acres. • Environmental Quality Incentives Program – Ramps up funding to achieve $1.3 billion/yr., split 60/40 between livestock and crop operations. • Conservation Security Program - A new national incentive payment program for maintaining and increasing farm and ranch stewardship practices.
Other Features • Adds $1.1 billion to trade programs • Adds $6.4 billion for nutrition • Adds $1.0 billion for rural development • Adds $1.3 billion for research • Creates an Energy title at a cost of $405 million with programs for bioenergy • Adds Country of Origin Labeling for meats. • Length of bill is 6 years.
De Minimis Rule • For the U.S., a five percent rule is applied for de minimis • For product-specific support, like loan gains, payments are compared to 5% of the value of production for the product • For non-product-specific support, like Counter Cyclical Payments and Crop Insurance, support compared to 5% of the total value of U.S. ag. production From Chad Hart
Historical Example From Chad Hart
Old New AMS under The 2002 Farm Bill From Chad Hart
Dairy price support Dairy Pmnts Sugar
WTO Compliance of The New Farm Bill • Given trend yield and price projections, the new farm bill is projected to be compliant with domestic support limitations • FAPRI analysis of the new farm bill put the probability of exceeding the WTO limit in the 2002 marketing year at 19.3% • For this analysis, the countercyclical program has been classified as an non-commodity-specific amber box program
Effects of Commodity & Conservation Provisions on Government Costs and Net Farm Income (preliminary FAPRI est.)
Closing comments • Big increase in spending vs. current law, but not vs. actual spending of last 4 years • “Back to the future” in terms of providing protection against lower prices • But retains producer planting flexibility without set asides • Major increase in conservation payments
Senate Vote on the Farm Bill Conference Report 26 states: Both Senators yes 12 states: Both Senators no 11 states split (4 on party lines) Helms of NC did not vote (yes from Edwards)