Download
1 / 112
1.12k likes | 1.29k Views
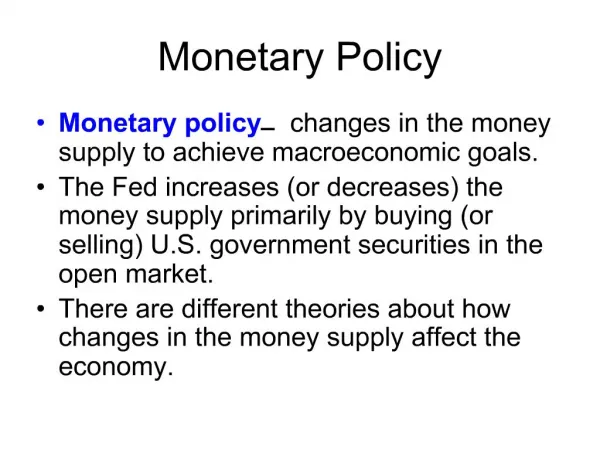
Monetary Policy Report February 2012. Figure 1.1. GDP growth in Sweden and the world Annual percentage change, seasonally-adjusted data. Sources: The IMF, Statistics Sweden and the Riksbank . Figure 1.2. GDP with uncertainty bands Annual percentage change, seasonally-adjusted data.

E N D
Figure 1.1. GDP growth in Sweden and the worldAnnual percentage change, seasonally-adjusted data Sources: The IMF, Statistics Sweden and the Riksbank
Figure 1.2. GDP with uncertainty bandsAnnual percentage change, seasonally-adjusted data Note. The uncertainty bands are based on the Riksbank’s historical forecasting errors. There is also uncertainty for the outcomes for GDP, as the figures in the National Accounts are revised several years after the preliminary publication. Sources: Statistics Sweden and the Riksbank
Figure 1.3. CPI with uncertainty bandsAnnual percentage change Note. The uncertainty bands are based on the Riksbank’s historical forecasting errors. Sources: Statistics Sweden and the Riksbank
Figure 1.4. CPIF with uncertainty bandsAnnual percentage change Note. The uncertainty bands are based on the Riksbank’s historical forecasting errors. The CPIF is the CPI with a fixed mortgage rate. Sources: Statistics Sweden and the Riksbank
Figure 1.5. Repo rate with uncertainty bandsPer cent, quarterly averages Note. The uncertainty bands for the repo rate are based on the ability of risk-adjusted market rates to forecast the future repo rate for the period 1999 up to the point when the Riksbank started publish forecasts for the repo rate during 2007. The uncertainty bands do not take into account the fact that there may be a lower bound for the repo rate. Source: The Riksbank
Figure 1.6. GDP in different regions and countriesQuarterly changes in per cent, annual rate, seasonally-adjusted data Sources: Bureau of Economic Analysis, Eurostat, Statistics Sweden and the Riksbank
Figure 1.7. Gross maturities, government bonds 2012Billions, EUR Note: Maturities including interest. Total maturities in 2012 as a percentage of the total gross public debt are 16.3 per cent for France, 19.3 per cent for Italy and 20.9 per cent for Spain. Sources: Bloomberg and the IMF
Figure 1.8. Government bonds with 10 years to maturityPer cent Source: Reuters EcoWin
Figure 1.9. Inflation in the euro area and the USAAnnual percentage change, quarterly averages Note. This refers to HICP for the euro area and CPI for the United States. Sources: Bureau of Labor Statistics, Eurostat and the Riksbank
Figure 1.10. TCW-weighted nominal exchange rate Index, 18 November 1992 = 100 Note. Outcome data are daily rates and forecasts are quarterly averages. TCW refers to a weighting of Sweden's most important trading partners. Source: The Riksbank
Figure 1.11. GDPQuarterly changes in per cent calculated in annualised terms, seasonally-adjusted data Sources: Statistics Sweden and the Riksbank
Figure 1.12. Households’ disposable incomes, consumption and saving ratio Annual percentage change and percentage of disposable income Note. Saving ratio including saving in collective insurance schemes. Sources: Statistics Sweden and the Riksbank
Figure 1.13. Household net assets and savingsPercentage of disposable income Note: Assets and saving ratio excluding saving in collective insurance schemes. Savings and disposable income are totalled over four quarters. Sources: Statistics Sweden and the Riksbank
Figure 1.14. Swedish exports and the world market for Swedish exports Annual percentage change, calendar-adjusted data Note. The export market aims to measure import demand in the countries to which Sweden exports. This is calculated by aggregating the imports of the 15 countries recieving the most Swedish exports. Sources: Statistics Sweden and the Riksbank
Figure 1.15. Investment ratioPer cent of GDP, current prices Note. Four-quarter moving average. Sources: Statistics Sweden and the Riksbank
Figure 1.16. Number of employed and hours workedThousands and millions, aged 15-74, seasonally-adjusted data Sources: Statistics Sweden and the Riksbank
Figure 1.17. Employment participation ratePercentage of the population, aged 15-74, seasonally-adjusted data Sources: Statistics Sweden and the Riksbank
Figure 1.18. UnemploymentPercentage of the labour force, aged 15-74, seasonally-adjusted data Sources: Statistics Sweden and the Riksbank
Figure 1.19. Proportion of companies reporting a shortage of labourPer cent, seasonally-adjusted data Source: National Institute of Economic Research
Figure 1.20. RU indicatorStandard deviation Note. The RU indicator is normalised so that the mean value is 0 and the standard deviation is 1. Sources: Statistics Sweden and the Riksbank
Figure 1.21. GDP and the labour market gapPer cent Note. The GDP gap refers to the GDP deviation from trend, calculated using a production function. The hours gap and employment gap refer to the deviation of hours worked and employment from the Riksbank’s assessed trends for these variables. Sources: Statistics Sweden and the Riksbank
Figure 1.22. Wages according to the National Accounts and to the short-term wage statisticsAnnual percentage change Note. The short-term wage statistics for the last 12 months are preliminary and are usually revised upwards. The yellow dotted line shows the Riksbank’s assessment of the final outcome. Sources: National Mediation Office, Statistics Sweden and the Riksbank
Figure 1.23. Cost pressures in the economy as a wholeAnnual percentage change Sources: Statistics Sweden and the Riksbank
Figure 1.24. CPI, CPIF and CPIF excluding energyAnnual percentage change Note. The CPIF is the CPI with a fixed mortgage rate. Sources: Statistics Sweden and the Riksbank
Figure 1.25. CPIFAnnual percentage change Note. The CPIF is the CPI with a fixed mortgage rate. Sources: Statistics Sweden and the Riksbank
Figure 1.26. Repo ratePer cent, quarterly averages Source: The Riksbank
Figure 1.27. Real repo ratePer cent, quarterly averages Note. The real repo rate is calculated as an average of the Riksbank’s repo rate forecasts for the coming year minus the inflation forecast (CPIF) for the corresponding period. Source: The Riksbank
Figure 2.1. TCW-weighted nominal exchange rateIndex, 18 November 1992 = 100, quarterly averages Note. TCW refers to a weighting of Swedens most important trading partners. Source: The Riksbank
Figure 2.2. Hours gapPer cent Sources: Statistics Sweden and the Riksbank
Figure 2.3. CPIFAnnual percentage change, quarterly averages Note. The CPIF is the CPI with a fixed mortgage rate. Sources: Statistics Sweden and the Riksbank
Figure 2.4. Repo ratePer cent, quarterly averages Source: The Riksbank
Figure 2.5. Inflation abroadTCW-weighted, annual percentage change, quarterly averages Note. TCW refers to a weighting of Sweden's most important trading partners. Sources: National sources and the Riksbank
Figure 2.6. GDP abroadTCW-weighted, quarterly changes in per cent calculated in annualised terms Note. TCW refers to a weighting of Sweden's most important trading partners. Sources: National sources and the Riksbank
Figure 2.7. Policy rate abroadTCW-weighted, per cent, quarterly averages Note. TCW refers to a weighting of Sweden's most important trading partners. Sources: National sources and the Riksbank
Figure 2.8. CPIFAnnual percentage change, quarterly averages Note. The CPIF is the CPI with a fixed mortgage rate. Sources: Statistics Sweden and the Riksbank
Figure 2.9. Hours gapPer cent Sources: Statistics Sweden and the Riksbank
Figure 2.10. Repo ratePer cent, quarterly averages Source: The Riksbank
Figure 2.11. Hours gapPer cent Sources: Statistics Sweden and the Riksbank
Figure 2.12. CPIFAnnual percentage change, quarterly averages Note. The CPIF is the CPI with a fixed mortgage rate. Sources: Statistics Sweden and the Riksbank
Figure 2.13. Repo ratePer cent, quarterly averages Source: The Riksbank
Figure 2.14. Alternative repo-rate pathsPer cent, quarterly averages Source: The Riksbank
Figure 2.15. CPIFAnnual percentage change, quarterly averages Note. The CPIF is the CPI with a fixed mortgage rate. Sources: Statistics Sweden and the Riksbank
Figure 2.16. CPIAnnual percentage change, quarterly averages Sources: Statistics Sweden and the Riksbank
Figure 2.17. GDP gapPer cent Sources: Statistics Sweden and the Riksbank
Figure 2.18. Hours gapPer cent Sources: Statistics Sweden and the Riksbank
Figure 2.19. UnemploymentPer cent of the labour force, aged 15-74, seasonally-adjusted data Sources: Statistics Sweden and the Riksbank
Figure 3.1. GDP abroadQuarterly changes in per cent calculated in annualised terms, seasonally-adjusted data Sources: Bureau of Economic Analysis, Eurostat and Office for National Statistics
Figure 3.2. Retail sales abroadIndex, January 2006 = 100 Note. TCW refers to a weighting of Sweden's most important trading partners. Sources: Eurostat, Federal Reserve Bank of St. Louis, national sources and the Riksbank
Figure 3.3. Unemployment abroadPercentage of the labour force, seasonally-adjusted data Note. TCW refers to a weighting of Sweden's most important trading partners. Sources: Bureau of Labor Statistics, Eurostat, Office for National Statistics, national sources and the Riksbank