Download

1 / 55
560 likes | 714 Views
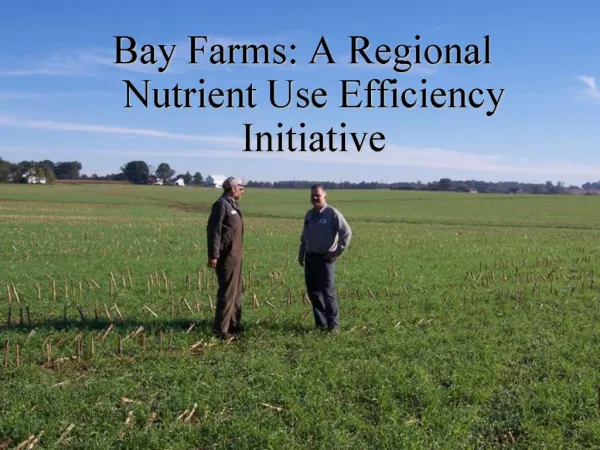
Manure management facilities on farms and their relevance to efficient nutrient use. Bernard Hyde & Owen, T. Carton Teagasc, Johnstown Castle The Fertilizer Association of Ireland Winter Scientific Meeting 25 th November 2005 Faculty of Agriculture, University College Dublin. Manure.

E N D
Manure management facilities on farms and their relevance to efficient nutrient use Bernard Hyde & Owen, T. Carton Teagasc, Johnstown Castle The Fertilizer Association of Ireland Winter Scientific Meeting 25th November 2005 Faculty of Agriculture, University College Dublin
Manure • 2003 - 6.3 million animals = 37 million tonnes • Slurry = 29.3 million tonnes • Solid = 7.7 million tonnes • Dairy cows ~ 28% of slurry & ~ 7% of solid manure
Topic – facilities & utilisation • Manure management facilities • Storage • Spreading date • Spreading method • Nutrient efficiency • Manure type • N, P & K • Cost vs. nutrient value
Requirements for efficient nutrient use • NMP • Changing slurry spreading date • Changing slurry spreading method • Storage vs. spreading date? • Cost benefit?
NMP • Soil • Manure • Crop demand • Code of Practice • Rate • Date • Method
Current utilisation? • Indicators? • FUS (2002 & 2005) • Indications of N, P & K overuse • Fert. input = Fert. required • Slurry? • Farm Facilities Survey (2003) – crop & timing of application
Topic – facilities & utilisation • Manure management facilities • Storage • Spreading date • Spreading method
Timing of slurry application WHY ? ?
Storage • Spreading date – 4% in winter • Estimated storage deficits – national basis • 21% for 16 week storage • 31% for 22 week storage • Action Programme • Ban on winter spreading • Required minimum slurry storage • Reconcile deficit and date?
Landspreading - N efficiency • N efficiency – key issue • Spreading date & rate • Soil/weather conditions • Contamination • Spreading date • Spreader availability • Farmer owned • Contractor
Slurry spreading opportunitiesDistribution of the number of days on which soils have a soil moisture deficit in excess of 10 mm. (Schulte et al., in press)
Silage contamination ? • End March/early April • Crop – too far advanced • Risk of poor fermentation
Spreader availability • C.S.O. – Census of Ag. 2000 • 124, 108 livestock farms (< 5 to >= 100 ha) • 72, 368 livestock farms (20 to >= 100 ha) • 31, 046 farms own or share slurry tankers • 35, 281 farms hire or borrow slurry tankers • Farm Facilities Survey
Farm Fragmentation 27% consist of 1 holding 31% have 4 + fragments
Farm Fragmentation – distance (km) Farm Fragmentation Fragment Distance
Topic – facilities & utilisation • Nutrient efficiency
Nutrient availability * Dry matter content varies widely and this determines the nutrient contents
N availability in slurry (Ammonium – N) Organic - N Inorganic - N
Spring NH3 Crop available NH3 Ammonium - N Summer
Current utilisation vs. available N • Spreading method • Spreading date • Soil/weather conditions
= =
NH3 = =
NH3 = NH3 NH3 NH3 =
Advantages of trailing shoe application • NH3 emission reduced • Recovery of total N ~ 40 - 50% • Slurry can be applied to taller crops • Slurry applied to soil surface – contamination ? • Increased opportunity for spring application • Heavier soils in wetter areas • Teagasc research
Organic N • Inorganic/organic = 50/50 • Organic material/solid fraction • Currently not considered as a reliable N source • Mineralization • 60 kg N/ha (33t/ha) for slurry • Teagasc research
Topic – facilities & utilisation • Cost vs. nutrient value
Economic value of slurry N (€ million) 88% 44% 22% 6%
Economic value of slurry N (€ million) € 67.2 € 3.8
Economic value of slurry N (€ million) € 67.2 € 14.8 € 3.8
Economic value of slurry N (€ million) € 67.2 € 29.5 € 14.8 € 3.8
Economic value of slurry N (€ million) € 67.2 € 59.1 € 29.5 € 14.8 € 3.8
Economic value (million €) of slurry € 83.9 million