Download
1 / 51
510 likes | 614 Views
Efficacy to Implementation in the Child Welfare System. J. Landsverk*, P. Chamberlain**, J. Reid** (Eve Reider***, Chair) PSMG October 26, 2005 * Child and Adolescent Services Research Center, San Diego, CA ** Oregon Social Learning Center & Center for Research to Practice, Eugene, OR

E N D
Efficacy to Implementation in the Child Welfare System J. Landsverk*, P. Chamberlain**, J. Reid** (Eve Reider***, Chair) PSMG October 26, 2005 * Child and Adolescent Services Research Center, San Diego, CA ** Oregon Social Learning Center & Center for Research to Practice, Eugene, OR *** National Institute on Drug Abuse, Rockville, MD
Cascading Dissemination of a Foster Parent Intervention (R01 MH 60195) Principal Investigator: Patti ChamberlainCo-Investigators: Joe Price, John Reid, John Lansverk Funding Agency: National Institute of Mental Health • Preventing Health-Risking Behavior in Delinquent Girls (R01 DA15208-1) Principal Investigator: Patti ChamberlainCo-Investigators: John Reid, Leslie Leve Funding Agency: National Institute of Drug Abuse • Preventing Problems for Girls in Foster Care (R01 MH54257-6) Principal Investigator:Patti ChamberlainCo-Investigators: Leslie Leve, John Reid Funding Agency: National Institute of Mental Health • Oregon Prevention Research Center (2 P30 MH 46690) Principal Investigator:John ReidCo-Investigators:Chamberlain, DeGarmo, Eddy, Fisher, Leve, Marinez, Fetrow, Patterson, Forgatch, Bank, Shortt, Capaldi Funding Agency: National Institute of Mental Health • Pathways Home: Reducing Risk in the Child Welfare System (1 P20 DA017592) Principal Investigator:John ReidCo-Investigators:Chamberlain, DeGarmo, Eddy, Fisher, Leve, Martinez, Fetrow, Bronz, Sprengelmeyer, and Smith Funding Agency: National Institute of Mental Health • Patterns of Youth Mental Health Care in Public Service Systems (U01 MH55282) Principal Investigator: Richard Hough Funding Agency: National Institute of Mental Health • Mental Health Services Across Child Welfare Agencies (R01 MH59672) Principal Investigator:John Lansverk Funding Agency: National Institute of Mental Health • Center for Research on Child and Adolescent Mental Health Services (P50 MH50313) Principal Investigator:John Lansverk • Improving Care for Children in Child Welfare (R24 MH67377) Principal Investigator:John Lansverk Funding Agency: National Institute of Mental Health • Mixed-Methods Study of a Statewide EBP Implementation (R01) Principal Investigator:Greg Aarons Funding Agency: National Institute of Mental Health
Child Welfare Service Sector – Characteristics Related to Design Issues
Effectiveness and implementation studies are service sector context specific (usual care), efficacy studies usually are not. Mission of Child Welfare Child Safety Child Permanence Child Well-Being Safety & permanence services provided by CW Well-Being services provided by other sectors (mental health, substance abuse services) Child Welfare as a Mission Context
Service Sector Comparisons on Risk level & Intervention Type, Reason for Entry & Sex Ratio
Service Sector Comparison on Age at Entry = Most common entry age into service sector
Context of Child Welfare • Yearly: 5,000,000 referred, 3,000,000 investigated (4.5% of all children), 826,000 substantiated for child abuse and neglect • Multiple living environments for child when services delivered: (1) home of origin, (2) out-of-home care or foster care [relative/non-relative, congregate care], (3) adoptive home • Service trajectories may involve movement from one child setting to another
Nationally Representative Child Welfare Cohort Study (NSCAW) • 92 primary sampling units, 6,000+ investigated cases (substantiated or indicated), followed for 36 months • 5 months after investigation • 1% in residential care (congregate) (5.7% after 36 months) • 10% in relative or non-relative family foster care • 24% received services in parent’s home • 65% no further services beyond investigation
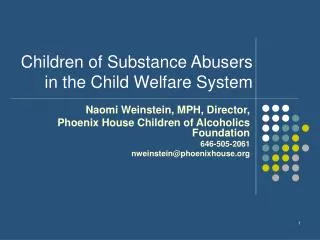
Need and Opportunity for Preventive Interventions • High rates of mental disorders (42% for ages 6-17 – POC San Diego study, highest rates for ADHD, ODD, CD), developmental problems , social and cognitive problems • At any given time, 1% of children under 18 live in out-of-home care, estimated to be 3-7% of all children at some time • Externalizing problems, mission elements of safety and permanence >>> parent mediated interventions
Child Welfare Context and Effectiveness Study Design and Measurement Issues • Multiple child settings – multiple environmental contexts and multiple parent informants for longitudinal designs • Clustering at entry – multiple children removed from same family and placed in out-of-home care with confounding by maltreatment type ( more clustering for neglect) • Clustering for case worker functions – supervisory units of 8-10 case workers • Timing for identification, sampling and enrolling because of early exit bias
Child Welfare Context and Effectiveness Study Design Issues • Little tradition of randomized study designs and use of standardized measurement • Labor force: (1) case workers - BA and MSW in social work, (2) para-professional foster parent (relative & non-relative), congregate care shift workers (BA level) • Cost analysis complicated by multiple sector costs: • safety and permanence costs are paid by child welfare • parent training costs paid by education sector (community college) • ameliorative costs (mental health, substance use, developmental) paid by other service sectors
Child Welfare Context and Effectiveness Study Design – Organization of Services • Multiple levels: state and county agencies, programs within agency, supervisory units within programs, families within case worker, children within families – adjustment for clustering and nested designs • Child nested within foster care and within biological family • Service programs organized by type of child setting – importance of change of setting and it’s meaning • Entry into services • Entry into out-of-home care • Change of placement within out-of-home care • Exit from out-of-home care • Exit from services
Collaborations among Disparate Research Traditions • Intervention Development and Efficacy Trials – relatively small n studies, “thick” measures with triangulation • Services Research and Clinical Epidemiology – large N studies, “thin” measures including administrative data • Prevention Science Methodologists
Developmental modeling and efficacy trials leading to effectiveness and Implementation trials of an intervention for foster parents in the CWS
Early trials of PMT • Crafted on basis of a great deal of clinical and systematic observation in homes • Case studies and small randomized trials. • Very thick measurement
Replications Across Developmental Level and Sites • OSLC: first graders through adolescents • Wahler: children • Webster-Stratton: preschoolers • Eyeberg • Forehand
Thick, Multi-Method Methodology • Naturalistic and laboratory observations • Parent, child, and teacher reports • Administrative data from schools and juvenile courts • Psychiatric data • Analogue Tasks
e5 e6 log Abusive e8 Index CEES CRSS Congruence Congruence Analog .33 e9 Physicals - Escalation .28** D3 D1 2 r r 2 .15 .30 e10 Anger Supervision- .70*** STAS - APT Tracking Punitive Discipline .40* Mother e11 e1 Inconsistent .23 .03 Education Discipline .44 -.17† Social Status e2 -.02 .81*** HEQSS Social .73*** Status Achieve- -.05 e3 .02 HEQACH CBCL T e13 .36*** D4 -.11 Mother Child e4 Occupation e14 Scenarios Child .22* Aggression Interviewer Care & e15 Rating Environmental r 2 .48 r 2 .12 Neglect Age 1.00 TRF T e17 D2 Neclect Sex e7 Index Word Slide of Neglect Model .38*** .71 -.55* .36 .18* .56* log IPC e12 Mother to Child .08 -.28* .47** .79 .30** .41 .20* .27* .13 -.33* .36** -.15 .62 .68 .66** .20* CBCL T e13b D4b .75 .25* Child .27** e14b Scenarios Child Aggression .20* WB Interviewer e15b Rating cmin=5356.00,df=\df,p=\p,cmindf=\cmindf,cfi=\cfi .39** r 2 1.29 TRF T e17b
Foster Parents as Agents of Change • Multi-dimensional treatment Foster Care
Multidimensional Treatment Foster Care (MTFC) • For youth placed in out-of-home care • Youth are placed singly in intensively trained and supervised community foster homes that are contacted daily and supported 24/7 for 6–9 mo. • Interventions are implemented using multiple methods (e.g., family and individual therapy, skill training, academic supports) in key settings • Program supervisors carry a caseload of 10, supervise foster parents, therapists, & skills trainers, and work with parole/probation officers • Youth attend public schools
MTFC Effects for Boys • More time in program/fewer runaways • Less time in “locked” incarceration in follow-up • Fewer criminal offenses (½ the rate of GC boys) • Less likely to commit violent crimes 2 years later • Delinquency effects mediated by: • Supervision • Relationship with a mentoring adult • Consistent non-harsh discipline • Less association with delinquent peers Chamberlain & Reid, 1998; Eddy & Chamberlain, 2000; Eddy, Whaley, & Chamberlain, 2004
MTFC Effects for Girls • Delinquency • Deviant Peer Association • School Attendance & Homework Time • Leve, Chamberlain & Reid (in press), J of Counseling and Clinical Psychology; Leve & Chamberlain (2005) J of Abnormal Child Psychology; • Chamberlain & Leve, in preparation
2.7 1.5 24-month arrest outcomes 6 5 5.2 4.5 4 Mean number of arrests 3 2 1 1.4 1.3 0.8 0.7 0 GC MTFC Intervention group 12 months pre-treatment entry 12 months post-treatment entry 24 months post-treatment entry
24-month locked settings outcomes 100 90 90 129 80 70 75 72 60 days in locked Mean number of settings 50 57 42 40 30 20 22 20 10 0 GC MTFC Intervention group 12 months pre-treatment 12 months post-treatment 24 months post-treatment
Efficacy to Effectiveness and Implementation Project Keep
Project KEEPCascading Dissemination of a Foster Parent Intervention A collaboration between the: San Diego Health and Human Services Agency, Child and Adolescent Services Research Center, Oregon Social Learning Center, and funded by the National Institute of Mental Health.
The Goals of KEEP • To increase the parenting skills of foster and kinship parents • To decrease the number of placement disruptions • To improve child outcomes • To increase the number of positive placement changes (e.g. reunification, adoption) • To test the “cascade” question-can the intervention be implemented with equal effectiveness by a second generation of interventionists?
Project KEEP aims to accomplish these goals by-- • Promoting the idea that foster parents can serve as key agents of change for children. • Strengthening foster parent’s confidence and skill level so that they can successfully change their own and their child’s behaviors. • Helping foster parents use effective parent management strategies and provide them with support to do so • Increasing short and long term positive child outcomes in multiple domains and settings – home, school, with peers.
Rates of child problems: Parent daily report (PDR) • PDR is collected by telephone from foster/kin parents • Each call takes 5-10 minutes • We collect 3 calls at baseline, another 3 calls 4 months later, and a final 3 calls 6 months after that (10 months after baseline) • PDR produces data on the occurrence of child behavior problems and foster parent stress
Greater than 5 problem behaviors per day at baseline predicts placement disruption within the next 6 months After 5 behaviors, every additional behavior on the PDR increases the probability of disruption by 13 %
Good news: We learned that… • Foster/kin parents tolerate about as much child problem behaviors as non-system families do –5 behaviors • PDR data is feasible to collect and is well tolerated by foster and kin parents • PDR data tells you who to concentrate the intervention on given limited resources : 40/60
PDR by interventionist cohortcontrol experimental
Conclusions • Preliminary data suggests KEEP group participation increase foster and kin parent skills • Increased parent skills translate into lower rates of child problem behaviors • Lower rates of child problem behaviors translate into fewer placement disruptions & more frequent placement transitions to family/relative care