Download
1 / 14
140 likes | 259 Views
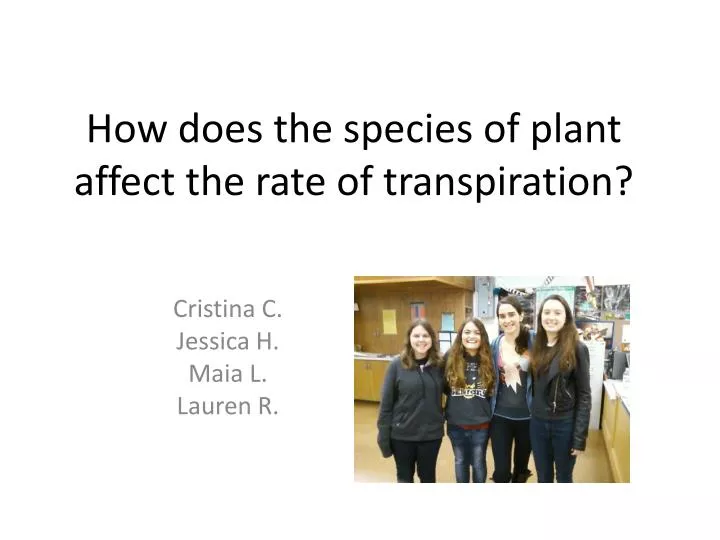
How does the species of plant affect the rate of transpiration?. Cristina C. Jessica H. Maia L. Lauren R. . So What?.

E N D
How does the species of plant affect the rate of transpiration? Cristina C. Jessica H. Maia L. Lauren R.
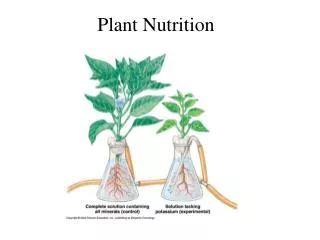
So What? • Different types of plants have different rates of transpiration. Those who have higher rates lose more water in high temperatures and wind and will therefore have to have access to more water to live. The rates of these species, therefore, determine the areas they will be able to grow in without human intervention (and if there is intervention, how much is needed).
Variables • IDV = species of plant • DV = air pressure in tube (mm Hg)
Materials • PASPORT Xplorer GLX • 3 PASPORT Barometer Pressure Sensors • 3 PASPORT Extension Cables • Large tub full of water • 3 Utility clamps • 3 finger clamps • 3 Plastic tubing clamps • 3 Plastic tubes • 6 Ring stands • Razor blade • 5 95W light sources • Metric ruler • 5 mL Plastic syringe • 3 plant cutting from 5 species • Flashdrive
Method • Take all the plant cuttings, submerge them in a tub of water, and cut the bottoms off. • Hook the plant to the plastic tubing, leaving a few centimeters of air at the other end. Attach all three plastic tubes (each one a separate trial) to a separate GLX barometer, and each barometer to the GLX sensor. • Turn the lights (95 watt incandescent bulbs) on and allow the plants five minutes to adjust. • Turn on the GLX sensor for 10 minutes to collect data every 10 seconds. • Repeat steps for all trials and all levels of IDV (each plant species).
Results Data Table #1: Average rate of transpiration for each species of plant (mmHg/sec)
Plant Species (levels of IDV) Plant A Plant B Plant E Plant D Plant C
Findings • Plant E had the highest rate of transpiration, with a rate of -0.0528 mmHg/sec. • Plant C had the lowest rate of transpiration, with a rate of 0.0012 mmHg/sec. • Plant A had a rate of -0.0088 mmHg/sec., Plant B had a rate of -0.0266 mmHg/sec., and Plant D had a rate of -0.0146 mmHg/sec. • This means that Plant E will have to live in places with cooler temperatures or have more access to water to be able to grow successfully. Plant C conserves water more, and will be able to live in a more arid environment.
Biological Explanation • We noticed that the plants with the highest rate of transpiration had leaves with the most surface area, while the plant with the least surface area (Plant C) had the leaves with the smallest surface area. • Transpiration is caused by negative pressure created by water evaporating through stomata on the leaves’ surface. The larger the surface area, the more stomata, which leads to more transpiration.
Error • A possible source of error was the irregular lengths of stems between the species. The longer the stem, the more leaves it would have, which would lead to a higher rate of transpiration. This could be fixed by having a regular length between all trials and levels of IDV. • Another source of error was the thickness of the plant species’ stems. With the kind of plastic tubing used, the stems had to be a certain thickness for the clamps to be able to create a vacuum within the plastic tubing to measure the pressure. Plant C, for example, had a thin stem that the clamp wasn’t entirely able to enclose. This left air to leak into the tubing and reduce the air pressure, giving false results that it had a lower rate of respiration. This could be improved if the experiment only used plants of the proper thickness or had different sized tubes to accommodate smaller widths of stems. • Another source of error would be the fact that the surface areas of the leaves were not controlled. Because the surface area was not controlled, the species with more leaves and larger leaves would have a higher rate of transpiration.
Ideas for Further Research • Take the five different species and measure the rate of transpiration in humid environments • Take the five different species and measure the rate of transpiration in windy environments • Take the five different species and measure the rate of transpiration in arid environments • Take the five different species and measure the rate of transpiration in cold environments