Download
1 / 22
220 likes | 318 Views
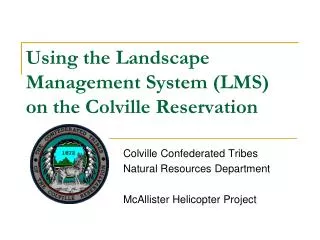
High-Tech Forestry: Using the Landscape Management System On Your Tree Farm. Family Forest Field Day Saturday September 18, 2004. Kevin Zobrist, UW College of Forest Resources Don Hanley, WSU Extension Rural Technology Initiative. What is the Rural Technology Initiative (RTI)?.

E N D
High-Tech Forestry: Using the Landscape Management System On Your Tree Farm Family Forest Field Day Saturday September 18, 2004 Kevin Zobrist, UW College of Forest Resources Don Hanley, WSU Extension Rural Technology Initiative
What is the Rural Technology Initiative (RTI)? • A cooperative between WSU extension and the UW College of Forest Resources • Mission: “Empower the existing infrastructure to use better technology in rural areas for managing forests for increased product and environmental values in support of local communities”
What does RTI do? • Software development • Trainings (LMS, GIS, GPS) • Studies of rural community issues
For More Information • On the web: www.ruraltech.org • Sign up for our mailing list • Pick up some brochures and Fact Sheets
The Landscape Management System (LMS) • Integrates a suite of useful tools • Growth Models: See how your forest will grow and change over time • Treatment Models: Simulate forest management activities on your forests and see the results • Visualization Models: A picture is worth 1,000 words! • Easy-to-use interface
LMS Outputs • Stand structure attributes • Trees per acre, avg. height and DBH • Basal area, SDI, RD, QMD, etc. • Forest health attributes • Fire and insect risk variables (Eastside) • Wind risk variables (Westside) • Environmental attributes • Stand structure class • Habitat suitability indexes • Product outputs • Volume (standing and cut) • Economic/Financial analysis
What if we leave it alone for 30 years? 2004 2014 2024 2034
What if we thin it now? 2004 2014 2024 2034
What if we thin now and again in 20 years? 2004 2014 2024 2034
Comparing Management Pathways No Action Avg Ht: 100’ Avg DBH: 13.0” Volume: 51.4 Mbf/ac Harvested: 0 Mbf/ac Thin Once Avg Ht: 107’ Avg DBH: 15.6” Volume: 47.4 Mbf/ac Harvested: 0.4 Mbf/ac Thin Twice Avg Ht: 113’ Avg DBH: 19.0” Volume: 30.0 Mbf/ac Harvested: 3.8 Mbf/ac
What can YOU do with LMS? • Simulate management alternatives over time • Generate pictures of your forest now and in the future • See the results of different levels of thinning • Monitor forest health • Do a financial analysis of your forest • Assess wildlife habitat potential • Create and demonstrate management plans • Stewardship plans • “Alternate Plans” • Other ideas?
The LMS Inventory Wizard • The key to LMS is good inventory data! • The Inventory Wizard is a tool to help you: • Get the inventory data you need and • Build your own LMS portfolio
Getting Started • LMS includes various growth models with geographic variants from around the country • The Inventory Wizard will: • Help you select the right growth model • Provide the appropriate field inventory forms
Field Inventory Forms • Print as many copies as you need • Can be printed on “Rite in the Rain” paper Stand data form (growth model specific) Plot data form
Thanks For Coming! Feel free to: • Ask questions • Try LMS Don’t forget to: • Sign in • Pick up an LMS CD • Pick up brochures and fact sheets *Fall Education Seminar* Saturday November 13, Eatonville, WA www.ruraltech.org