Download

1 / 21
210 likes | 314 Views
The Best Trading Info.Com ____________________________________________. An Investment Opportunity for Financial Independence. To Our Investor Friends:.

E N D
The Best Trading Info.Com____________________________________________ An Investment Opportunity for Financial Independence
To Our Investor Friends: This report is about becoming a successful investor. This year. Next year. And every year thereafter, as long as there is an American stock market. This detailed explanation will help you to understand the important facets of this trading system. ____________________________________________
The System Design: This system has been designed with years of experience in trading the stock market along with in-depth research based on the Dow Jones Industrial Average (DOW) price movement back to 1900. The proprietary computer program uses selected historical DOW data to create a fingerprint of each stock that produces well-defined, specific characteristics unique to that stock. These historical fingerprint characteristics, when aligned with a combination of technical factors, produce trading opportunities. ____________________________________________
Design Continued: The work on this trading model was written as a short-term system designed to take advantage of extreme conditions by getting in and out of the market in 20 days or less. The success of the model is driven by several key factors some of which are: The mathematical equations written into the computer program for each individual stock and index based on its history. The experience to manage the model properly. The discipline it takes to act at the proper entry and exit points of each trade. Less overall long term market exposure. ____________________________________________
The Bands & The Fingerprint: This trading model will indicate potential trading price entry points at what are labeled bands. There are two lower bands and two upper bands. These bands suggest points of entering the market with at least an 80 percent chance of a successful trade based on that stock’s individual mathematical fingerprint. With many stocks, the first band reached offers the opportunity for gain depending on the history of the individual stock. If the stock price reaches the second band (upper band 2 or lower band 2 on the charts) and the technical indicators are in alignment, the probability of a successful trade is especially high. ____________________________________________
What Makes It Work: Let us explain the band trade first. There are certain stocks that qualify for band trades. The idea was to actually fingerprint these stocks using very specific parameters: Each stock chosen would have at least 10 to 15 years of history, and 90 percent would have 100 million shares or more outstanding. Each stock’s technical and fundamental history included certain factors: debt, book value, ex-dividend date, dividend yield, 5-year price/earnings ratio, average correction percent up and down, and average minimum and maximum time of correction for each stock. Each stock was based on a sufficient level of trading volume and participation by institutions in order to provide liquidity. ____________________________________________
All of these factors made each of these large stocks more predictable at extreme price conditions. When a stock came into alignment with the analysis of the technical and fundamental factors, the system suggested it was time to execute a trade. ____________________________________________
Because the band trades did not produce enough trades per year needed for a total-viable trading system, We devised the technical part of the system using a separate list of non-banded stocks. Used were many of the same technical factors and formulas developed for the band trades. This technical system allowed the computers to track many more stocks allowing for more profitable trading opportunities.In practice, the technical trades disregard some of the requirements of the band trades. As a result, the technical trades created an outstanding trading result, offering a 70-75 percent probability for success, but falls a bit short of the 80 percent success rate of the band trades. Adding to What Works: ____________________________________________
Let’s take a closer look at the technical reasons that the system works. In the long run, the price movement of stocks reflects human behavior. Now and throughout history, the mass of human behavior becomes either overly optimistic or overly pessimistic. With investments (in our case, stocks & indexes), this extreme in mass opinion creates rare windows of opportunity. How do you take advantage of this opportunity? By investing in a position contrary to the extreme direction of the masses, investors profit when this extreme readjusts to more normal price behavior (our historical fingerprint). The Technical Factors: ____________________________________________
Each stock and index in the system is scanned daily. When a stock reaches a price determined by the mathematical calculations to be an excellent point to enter the market inside the bands (lower or upper) or when the technical parameters are met. The management team evaluates every opportunity and selects only those with the greatest risk/reward potential, while minimizing the risk. The system is designed to predict a 5 percent to 10 percent price movement in a stock in a short amount of time with limited risk by taking advantage of highly predictable, quick moves (up or down) in the price of stocks when volatility is considered the greatest. ____________________________________________
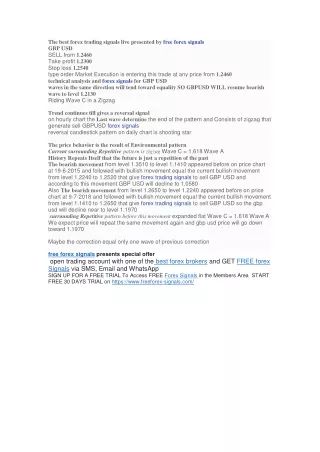
How Banded and Technical Stocks Produce Profits: Using the well-known cliché that a picture is worth 1,000 words, following are four charts that show how profits are earned with the highly capitalized banded and technical stock signals. Examples are made for illustration only and are not to be interpreted as guarantees. ____________________________________________
Example of a “Daily Band” Sell Signal: ____________________________________________
Example of a “Daily Band” Sell Signal and Buy Signal: ____________________________________________
Example of a Daily Technical Sell Signal: ____________________________________________
Example of a Daily Technical Buy Signal: ____________________________________________
Normally, a stock trading system must accomplish four tasks: Predict the direction of the market as a whole. Select the right stock. Execute the buy at the right time. Sell at the right time. The timing for all four corners of these tasks must be near perfect for a large profitable trade and usually demands that the position be held for months or years. Our trading system on the other hand, only requires that the stock selected move in the right direction (up or down) for a short window of time. Mathematically, a much easier task to accomplish than long-term predictions. (As with trying to predict the weather you can be much more accurate to predict it correctly in the short term as apposed to the long term). ____________________________________________
Economists describe this stock-price movement as the expanding or contracting of price elasticity. Noneconomists think of elasticity as the forces causing elastic to be stretched to its mathematical limit as predicted by its history. Usually, 8 or 9 times out of 10, this price elasticity pressure releases by 5 to 10 percent within 1 to 20 trading days. Sometimes, 1 or 2 times out of 10, the price movement continues to move in the direction of mass opinion (can be either buying or selling), thus breaking the stock’s historical limit but creating new history -- new fingerprint -- that can be used to better define the stock’s future limits. Price Movement: ____________________________________________
Perry Levy has 37 years of trading experience in stocks, bonds, commodities and options trading. Mr. Levy holds a Series 65-Investment Advisors license, a Series 3-commodity license and through the 1980s and 90s was Sole Proprietor of Levy Investments. Over the years Mr. Levy has developed and implemented a proprietary trading system he based on a theory of his own using the DOW industrials back to 1900. After proving the theory worked in the early 1990s he began implementing this system with the use of computer programs and as the speed and capacity of computers became greater and faster so did his trading system as he took full advantage of this technology. In the year 2000 Levy Investments became P D Capital Management, LLC and the hedge fund Apex Trading Partners, LP was started. Mr. Levy actively evaluates all trades for the best possible strategy, entry and exit points to be used with his trading system. He manages stock and options positions and continues to improve on his trading system.Managing Member for Apex Trading Partners, LP, Hedge Fund manager. Actively trades stocks, stock options, indices and commodity based ETF’s . Perry A. Levy ____________________________________________ Registered Investment Advisor:
Knowing Perry Levy for a lifetime David Vierra began working with Perry in 1995. At that time Levy Investments was in the development stages of operation limited to one computer and one proprietary trading system. Over the years since then Mr. Vierra has assisted in the research and development of proprietary trading systems, the expansion of software programs, multiple hardware upgrades and the increase of monies under management. In 2000 Levy Investments became P D Capital Management, LLC that developed Apex Trading Partners, LP a Hedge Fund. P D Capital Management, LLC is now running multiple trading, market tracking analysis systems and programs. As a General Partner for P D Capital Management, LLC and Registered Investment Advisor Mr. Vierra controls trading and the management of stock and options positions for their clients. Managing Member for Apex Trading Partners, LP, Hedge Fund manager. Actively trades stocks, stock options, indices and commodity based ETF’s . David R. Vierra ____________________________________________ Registered Investment Advisor:
FINANCIAL DISCLOSURES: Our program trading system is an art, not a science. Past results are no guarantee of future performance. Although every attempt to limit risk in this trading strategy has been taken, all risk in any Investment cannot be totally eliminated. Examples are made for illustration only and are not to be interpreted as guarantees. ____________________________________________
The Best Trading Info.Com If you are not interested in trading for yourself we manage individual accounts under P D Capital Management, LLC using this very system. For more information about managed accounts contact us at: info@thebesttradinginfo.com The Best Trading Info P O Box 1234 Reno, NV 89504 ____________________________________________