Download
1 / 1
10 likes | 97 Views
How Big Is That Hole? Using ArcGIS to Calculate the Volume of Sediment Needed to Mitigate Erosion of an Archaeological Site Sean Stcherbinine – Resource Management Program. RESULTS AND DISCUSSION. METHODS. Background.

E N D
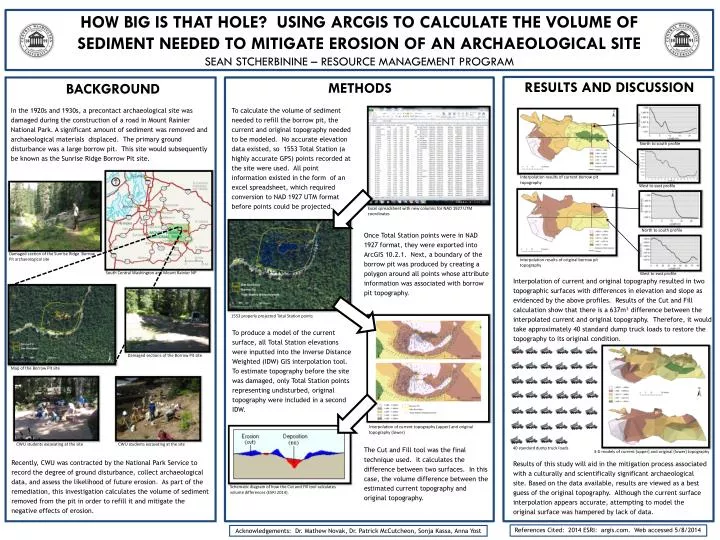
How Big Is That Hole? Using ArcGIS to Calculate the Volume of Sediment Needed to Mitigate Erosion of an Archaeological Site Sean Stcherbinine – Resource Management Program RESULTS AND DISCUSSION METHODS Background In the 1920s and 1930s, a precontact archaeological site was damaged during the construction of a road in Mount Rainier National Park. A significant amount of sediment was removed and archaeological materials displaced. The primary ground disturbance was a large borrow pit. This site would subsequently be known as the Sunrise Ridge Borrow Pit site. To calculate the volume of sediment needed to refill the borrow pit, the current and original topography needed to be modeled. No accurate elevation data existed, so 1553 Total Station (a highly accurate GPS) points recorded at the site were used. All point information existed in the form of an excel spreadsheet, which required conversion to NAD 1927 UTM format before points could be projected. North to south profile Interpolation results of current borrow pit topography West to east profile Excel spreadsheet with new columns for NAD 1927 UTM coordinates North to south profile Once Total Station points were in NAD 1927 format, they were exported into ArcGIS 10.2.1. Next, a boundary of the borrow pit was produced by creating a polygon around all points whose attribute information was associated with borrow pit topography. Damaged section of the Sunrise Ridge Borrow Pit archaeological site Interpolation results of original borrow pit topography South Central Washington and Mount Rainier NP West to east profile Interpolation of current and original topography resulted in two topographic surfaces with differences in elevation and slope as evidenced by the above profiles. Results of the Cut and Fill calculation show that there is a 637m³ difference between the interpolated current and original topography. Therefore, it would take approximately 40 standard dump truck loads to restore the topography to its original condition. 1553 properly projected Total Station points To produce a model of the current surface, all Total Station elevations were inputted into the Inverse Distance Weighted (IDW) GIS interpolation tool. To estimate topography before the site was damaged, only Total Station points representing undisturbed, original topography were included in a second IDW. Damaged sections of the Borrow Pit site Map of the Borrow Pit site Interpolation of current topography (upper) and original topography (lower) Recently, CWU was contracted by the National Park Service to record the degree of ground disturbance, collect archaeological data, and assess the likelihood of future erosion. As part of the remediation, this investigation calculates the volume of sediment removed from the pit in order to refill it and mitigate the negative effects of erosion. CWU students excavating at the site CWU students excavating at the site The Cut and Fill tool was the final technique used. It calculates the difference between two surfaces. In this case, the volume difference between the estimated current topography and original topography. 40 standard dump truck loads 3-D models of current (upper) and original (lower) topography Results of this study will aid in the mitigation process associated with a culturally and scientifically significant archaeological site. Based on the data available, results are viewed as a best guess of the original topography. Although the current surface interpolation appears accurate, attempting to model the original surface was hampered by lack of data. Schematic diagram of how the Cut and Fill tool calculates volume differences (ESRI 2014). Acknowledgements: Dr. Mathew Novak, Dr. Patrick McCutcheon, Sonja Kassa, Anna Yost References Cited: 2014 ESRI: argis.com. Web accessed 5/8/2014