Download
1 / 71
710 likes | 840 Views
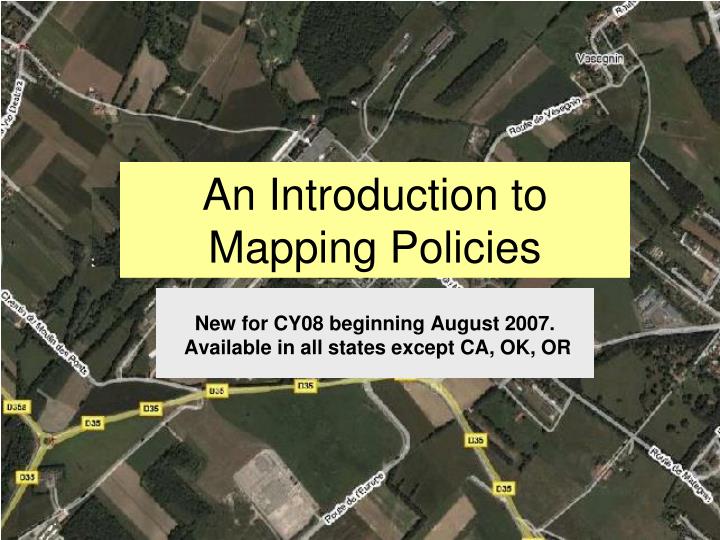
An Introduction to Mapping Policies. New for CY08 beginning August 2007. Available in all states except CA, OK, OR. New!. Policy Mapping Service. Software Blueprint. The screen is divided into 3 sections. You will usually work from left to right.

E N D
An Introduction to Mapping Policies New for CY08 beginning August 2007. Available in all states except CA, OK, OR
New! Policy Mapping Service
Software Blueprint The screen is divided into 3 sections. You will usually work from left to right. Remember to disable your pop-up blocker:
Log on www.afbisinc.com (To practice mapping use http://test.afbisinc.com) Note: AFBIS TEST uses the same account info as the live AFBIS website. Remember only live data – not Test data - will roll from 2007 to 2008. If you have not yet done so, you must create your own password. • Requires Internet Explorer 5.5 or greater. • Must have high-speed internet access (not dial-up) to utilize mapping software • A color printer would also be necessary for printing mapped fields.
To get to mapping, Click on Policy Information Note: Only existing MPCI or Hail policyholders can be mapped.
If live, Change Crop Year to 2008, thenselect “Mapping” from the Dropdown next to the insured’s name This will launch you out to the mapping software.
Must be signed PRIOR to mapping. Customer grants authority to agent to move policy data into mapping software. Form can be printed from E-Commerce forms on AFBIS Information Release Form
Mapping an ExistingPolicy in 5 Easy Steps: “Zoom to Section, Add layer/images, Select /Add the Field Border, Name it and Save it.
Step 1: Click on a gray section(It will zoom in.)If policy has legals, it will open in “Farm View”. A gray shadow indicates sections in the operation. FARM VIEW: an overview or a bird’s eye view containing a section grid with Township Names and Legals. Navigation Hint: As you begin to map the fields, note that there is no “Back” key. “Farm View” and the “Zoom keys” can be used like “Back Arrows” to previous views. You may also navigate back to AFBIS or prior views using the web address in your tray. Tip: The web mapping connection will time out if idle at 20 minutes. Restart in AFBIS to launch.
STEP 2:Turn on the FSA Photo and Field Boundaries to add CLU layer.(Note that the “Add” tool will highlight) Automatically loads most recent FSA Aerial Photography. Provides earlier FSA photos if needed. The tool “Add FSA Fields” chooses an existing CLU boundary from the layer for saving to the policy.
STEP 3: Hold Control & Click all fields with the same FSN. STEP 4: Enter Farm Name and FSN STEP 5: Click “Add Selected Fields” (Save) Hint: You need the farmer or FSA maps to distinguish which fields belong to which FSN.
This is the Confirmation of one FSN with multiple fields added to policy.(Note that field boundaries change to GREEN.)Click “Return to Map View” to map the next section.
Common Land Units (CLU) • A Common Land Unit is the smallest unit of land that has a permanent, contiguous boundary, a common land cover and land management, a common owner and a common producer in agricultural land associated with USDA farm programs. CLU boundaries are delineated from relatively permanent features such as fence lines, roads, and/or waterways. • The FSA is NOT done creating CLUs yet. You can check the availability of CLU data by county at: www.agridatainc.com/availablemaps.htm or Contact your FSA county office to find out when their CLU data will be publicly available. • Released CLU layers are loaded into the mapping software as soon as FSA makes them available. If you click on the CLU layer and no red boundaries appear, there is no CLU data available and you will need to use the “Draw Field” tool to create and save the boundaries of the fields in the operation.
FSA PhotoUpdates • The Aerial Photography Field Office is a division of the Farm Service Agency (FSA), of the United States Department of Agriculture (USDA). The USDA has been involved in the acquisition, use and distribution of aerial photography for more than 65 years. • The Farm Service Agency has used aerial photography to track farm records by drafting farm tract and field boundaries onto aerial photographic enlargements. This allowed for USDA workers and farmers to interact with USDA farm programs. The aerial photos were rectified to allow for accurate measurements. Counties were previously furnished new imagery on average every five years. • Normally the Midwest is flown every year during the summer or fall. However due to budget constraints, Congress has only authorized to fly the states in the map above for 2008 which should be available by the end of December, beginning of January.
Added Land & FSA CLUs Layers • You can also import shape files from hand held GPS units or upload FSA.dbf files and .shx files for the added land. • Open policy in AFBIS • Select Mapping Solutions • Select Section • Choose “Tools” / “Manage Fields” • Click “Upload Borders from File” • Click “Browse” and file on CD or email attachment • Click “Add Fields” button • Remember that FSA files include HEL and CRP fields that will need to be removed. • If you get the file from FSA via Email, there is no charge. If you provide CD, it costs $50 fee to burn the files – in 7-10 business days. This request form is available from online “Help / CLU Request Form ”
FSA 578 Comparison • The mapping software includes Text file description of the CLU Layer for you to compare against an actual FSA 578 for missing and incorrect legals. • To view this look alike form: • Click “Tools” & “Manage Fields” - Click “View Form 578” • Choose “File” and “Print”
Got High Risk? Add the Layer! The crops that are high risk are now listed on the right side along with the high risk rating. Click on acres in High Risk Area
Soil Type Layer:Turn off Photo, Check on Soil LayerFrom Tool Bar at left, click on Soil Info and click on a field.The Code and Soil Description are shown in a new window
Field Log Booklet – Portrait View Agents can print pages on 8.5 x11 paper, then fold, trim and staple to check book size. Clear checkbook covers are available for purchase for less than a $1.00 ea. The portrait has only 3 field entries per page. Landscape has 10 entries per page.
Field Log Booklet – Landscape View (Header info will be populated at top.) NOTE: That is the Insurance Company logo with Agency name and address – no agency logos can be substituted.
Choose “File” / “Print Reports” to print ALL section maps. Choose File/Print from Adobe menu. There is $0.03/ac charge to print maps that have had the boundaries drawn/saved. If you do not save boundaries, there is a $2.00 fee per “blank” map. Both fees are paid for by the company. Individual “section” maps on your screen can be printed from File / “Print Map”. Suggestions for blank maps: Send field maps with the client PRIOR or during appointment. May use for tracking acreage as they are planting or harvesting. (You may choose to purchase folders or clear-cover protectors which allow the professional, color maps to show.) Printing Blank Maps Printouts include policyholder’s name and your agent name and contact information (Sorry can’t import logo)
Print Options (Optional Selections) (Usual & Customary)
A report of all maps will print with the “Farm View” first followed by sections in numeric order. Non-mapped sections (gray) Mapped fields (green) Reported Fields (red)
You can also print mapped fields without the Photo Layer which leaves more white space for recording harvested production or other information.
Sample Field Activity Report Printed With the Maps for Farmer Use
Field Editing Tools • Grid w/ gray square identifying sections in operation. • Move left, right, up, down by clicking “Pan” and touching map with mouse at where you need to go. • Data box containing descriptors and ACRES for field • Click Split, click just outside opposite borders, adjust acres, save • Click Tool, select fields, click Merge Field button. (You can only merge fields that have been split.) • Use “Delete Field” to remove/click on non-insured fields and to correct drawing errors. • To Add Pivot: first map field, click Add Pivot, Key diameter of pivot in feet, then drag/position circle in field. Click Save. • This is the drawing tool. Click around field with mouse.
A “Field Info Box” is connected to each field. When viewing a section, this box will launch when you click on the Field Info from the Tool Bar on the right menu. FSN: Existing Farm Serial Numbers will load from AFBIS policy data. If you are entering a NEW FSN, a pop-up appears to record the farm number and it will be available to choose for other fields. There is currently NO interface to carry the new FSN to AFBIS so it must be re-keyed in AFBIS. Acres: Calculates from image borders, may be adjusted to match 578. RMA allows for 10% variance. Sharename: Leave blank for 100% or pick shareholder with correct % of interest from dropdown. Field Information Window
To Delete a Field, Select Tool, click field, and click “Delete from right menu.
Split a Field or Delete Water/Trees • Click “Split” and the field, an editing box will open • Click just outside a field border to begin your dividing line. To divide, • Click again just outside an opposite border and a dividing line will appear. • Click Adjust Acres" to move the split line, Click "Save" • To outline or subtract trees or water area inside of a field, click the “SPLIT” tool and then click multiple times around the item in the field. • Enter calculated acres into corresponding color-coded boxes & "Save" (Tip: You cannot split a field that has a crop reported. You will need to set the field to 'No crop' in Acreage & Production.)
To Add Pivot:1) Map field 2) Click “Add Pivot” 3) Key diameter of pivot in feet 4) Drag/position circle in field. 5) Click “Save”.
To copy borders from one policy to another… • Inside of a mapped policy, Choose “Tools” and “Manage Fields” • 2) Click “Export Field Borders” • 3) Click the resulting link and “Open” • 4) Choose “File /Extract All” to some Temporary folder or your desktop
Next, Import the Borders into Another Policy … • 5) Go back to AFBIS. • - Find the Companion policy, • Select “Mapping Solution”. 6) Select “Tools” / “Manage Fields” 7) Select “Upload Borders” from File”
Importing Borders into another policy continued… 6) Click Browse and Select the saved temp file per extension type. (Repeat for each type) 6) Click “Add Fields” 7) You will receive a confirmation of import 8) You may need to refresh the map
Mapping a Customer with No Legals(Section, Township, Range) For new insured with no prior history or If you were GRP/GRIP last year and did not report/key the legals or No Rectangular Survey System in the county
“Zoom In” should be highlighted, then click your state and county. The Zoom keys can be used like “Back Arrows” to previous view.
To NAVITGATE:Click “Zoom In & Out” and/or the Compass and then click on map to navigate left, right, up and down.Hint: If you zoom too close, you can loose some layers.Or can use the mouse and draw a square area to zoom to.
Add Sections and/or High Risk Layers (hash marks)to help you locate fields. Then click on the Section(Currently High Risk only shows on the screen, not on printouts)
As you zoom in, different layers and new menu options will appear
The section will open with the “Draw Field” tool on. Repeatedly click your mouse in each corner or around the field. (Do not hold down and drag the mouse.) Add Field Descriptions and Save Boundaries. Note: The drawing tool uses a product called VML which is included in a standard install of Internet Explorer. If VML was not installed, the user will be prompted by a message asking to install VML when the mapping web page opens up.
Enter Farm Name(s) and Save Border • Within each section, the software will auto-number the fields you draw with consecutive ID #s. • Existing FSNs will be in the dropdown, if you have a new FSN or tract, click “New” and enter in pop up box. • A field drawing is complete when boundaries touch and the acres total. • Click “Save Border”. • If you do not like your drawing, click “Remove Border” and then try again with “Draw Field”. F1 29.1 (Reflects accuracy when when drawing boundaries. Must be within 10% variance.)
The Interface • The Interface transfers acreage report data from mapped fields into AFBIS eliminating double keying for Acreage Reports. • Parts of the Interface are still being developed. At this time, only “clean” ARs can be submitted in mapping. (No Added, land, PP, Late Acres) Although the mapping reporting screen provides a place for yields, the interface is not functioning at this time. Report production via the AFBIS website APH form. • The “Reporting of Acres” is one way – meaning the AR data will copy over into AFBIS only. If you report production and acres directly in AFBIS, the data will not populate the maps or mapping forms. • However, descriptive data changes that do NOT require manual approval from Underwriting (like FSNs and Share %) will upload into the mapping software if you change it in AFBIS BEFORE you map. If you update in mapping it will not copy into AFBIS.
Note: Existing Unit Descriptions can’t be edited while reporting in Mapping Software.
To Report Acres:Click “Report Acreage”, Click on a Field,Enter Data, “Save” Corn When submitted an AR in the mapping software: You cannot report acres until the boundaries are added/saved. You can’t “submit” until data is keyed for every field.
Reported fields are shaded. When done reporting, click “Tools”, “Submit Acreage”
To View / Print the AR with Map, Click File/Print Report, Build, and PDF Link
Sample AR with Map (for “clean reports”) Maps will print one section per page and in section # order. (Signature blank on last page) Maps can be saved as PDFs. (Saving to CD is pending.)