Download
1 / 5
60 likes | 215 Views
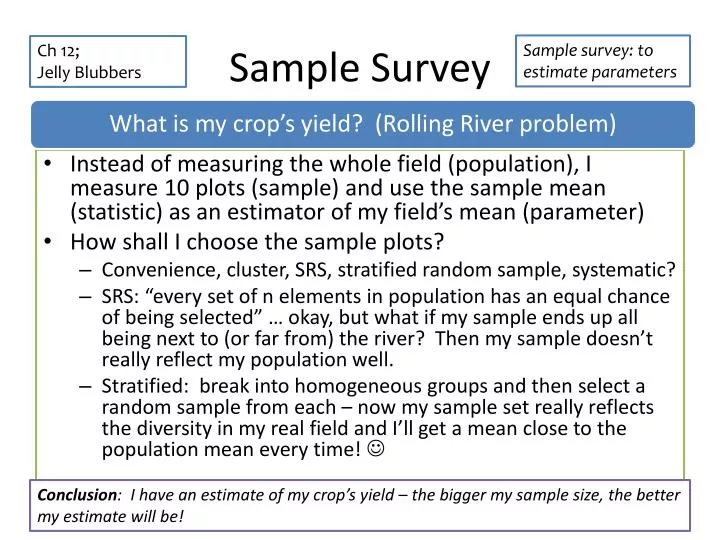
Sample Survey. Sample survey: to estimate parameters. Ch 12; Jelly Blubbers. Instead of measuring the whole field (population), I measure 10 plots (sample) and use the sample mean (statistic) as an estimator of my field’s mean (parameter) How shall I choose the sample plots?

E N D
Sample Survey Sample survey: to estimate parameters Ch 12; Jelly Blubbers • Instead of measuring the whole field (population), I measure 10 plots (sample) and use the sample mean (statistic) as an estimator of my field’s mean (parameter) • How shall I choose the sample plots? • Convenience, cluster, SRS, stratified random sample, systematic? • SRS: “every set of n elements in population has an equal chance of being selected” … okay, but what if my sample ends up all being next to (or far from) the river? Then my sample doesn’t really reflect my population well. • Stratified: break into homogeneous groups and then select a random sample from each – now my sample set really reflects the diversity in my real field and I’ll get a mean close to the population mean every time! Conclusion: I have an estimate of my crop’s yield – the bigger my sample size, the better my estimate will be!
Goal: collect info from a target population to predict association Observational Study Rossman13-1 BVD p 267 • Select a random sample representative of the population (SRS, cluster, stratified, systematic) • Ask the question in a way that avoids “systematic over/underrepresentation of one response” (bias) • So I won’t ask “how many nutritious, healtful, wonderful apples to you eat every day?” … I’ll come up with a better way! Conclusion: There appears to be a connection between apples and doctors in 20-50-year olds!
Observational Study Factor: apples Levels: 0 or some My living subjects Response variable Stratified random sample (I’m not studying effect of exercise, so it’s not a factor!). I’m just afraid if I just take a random sample, I might end up with a group of all health-nuts which doesn’t really represent my population
Goal: impose treatments in a controlled environment to determine cause & effect Experiment Rossman13-6 BVD ch 13 • I’m not really selecting a random sample; I just have 18 cars to test. But I can randomly assign treatments – that’s what makes it an experiment. • Remember: randomize, control (placebo), block (if necessary), replicate. • Some blindness would be nice to prevent unnecessary bias • Could blind the subject only (single-blind) • Could blind the evaluator only (single-blind) • Could blind both (double-blind) Conclusion: my additive increases mpg by 500% (wow! I should get some of that for my car!)
Experiment Factor: gas additive Levels: 0 (control) or some My inanimate experimental units Response variable Blocked design. Maybe small cars react differently than luxury; I want to generalize to all of them, so I’ll make sure to treat the same proportion of each (½ the small ones and ½ the luxury mobiles) Randomly apply treatment to ½ the cars in each group