Download
1 / 62
640 likes | 917 Views
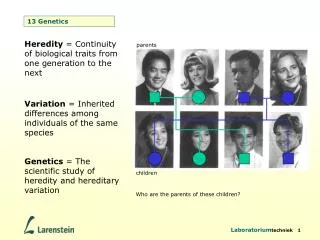
Variation (individual differences): Stature (in cm) in Dutch adolescent twins. Caused by: - differences in genotype (G)? - differences in environment (E)? - interaction between G and E?. Individual differences in human characteristics, e.g. normal and abnormal behavior. 1 Gene

E N D
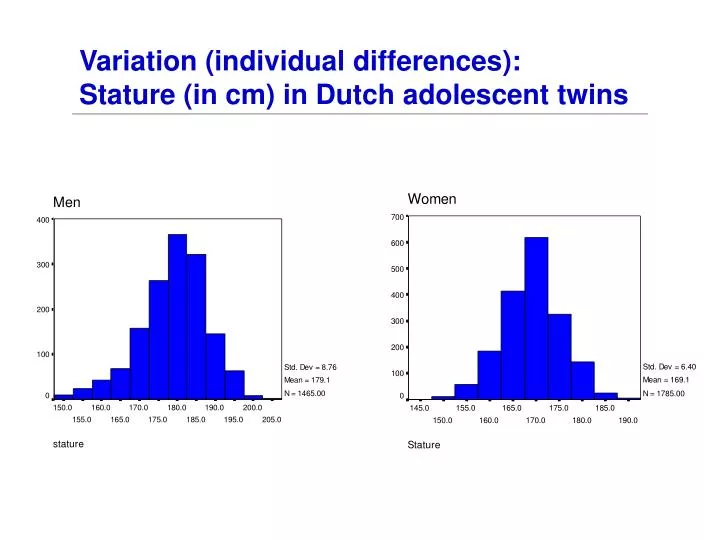
Variation (individual differences):Stature (in cm) in Dutch adolescent twins
Caused by:- differences in genotype (G)?- differences in environment (E)?- interaction between G and E? Individual differences in human characteristics, e.g. normal and abnormal behavior
1 Gene 3 Genotypes 3 Phenotypes 2 Genes 9 Genotypes 5 Phenotypes 3 Genes 27 Genotypes 7 Phenotypes 4 Genes 81 Genotypes 9 Phenotypes Complex: Polygenic Traits
Mendel:Laws of inheritance for monogenic traits: 1 Segregation 2 Independent Assortment Galton: correlations between family members for continuous traits: Family & Twin Resemblance. Fisher: traits can be influenced by more than one gene (which each can have small effects). Effects of genes add up and lead to a normal distribution in the population.
Stature in male and female twins (correlations) Twin Correlations MZM: 0.95, MZF: 0.92, DZM: 0.60, DZF: 0.52
[Galton, 1889] Traits influenced by genes will be correlated among biological relatives
Brain volumes: resemblance of MZ and DZ twins 1400 1400 1200 1200 1000 1000 800 800 800 1000 1200 1400 800 1000 1200 1400 Brain volume DZ twin pairs (milliliter) in twin and co-twin Brain volume MZ twin pairs (milliliter) in twin and co-twin
‘Identical’ twins Monozygotic (MZ) twins: ~100% genetically identical
Fraternal twins Dizygotic (DZ) twins share ~50% of their segregating genes
DZ twins MZ twins Twin Model • Twin correlations for cholesterol levels (17-yr old twins) • rMZ = 0.86 & rDZ = 0.46 • Heritability = 80% (=2(.86-.46))
Designs to disentangle G + E • Family studies – G + C confounded • MZ twins alone – G + C confounded • MZ twins reared apart – rare, atypical, selective placement ? • Adoptions – increasingly rare, atypical, selective placement ? • MZ and DZ twins reared together • Extended twin design
Bouchard & McGue: Genetic and environmental influences on human psychological differences (2003) Intraclass correlations MZT MZA (626 pairs) (74 pairs) Positive emotionality .55 .43 Negative emotionality .44 .47 Constraint .56 .58
* known zygosity* EEA: equal environment (including prenatal)* representative Classical twin design: Assumptions
Zygosity DZ = DOS DZ = very unlike in appearance DZ = different at marker loci (except for measurement error) MZ = mono-chorionic MZ = identical at marker loci (except for rare mutations) MZ and DZ twins: determining zygosity using ABI Profiler™ genotyping (9 STR markers + sex) MZ DZ DZ
EEA: Placentation and zygosity Dichorionic Two placentas MZ 19% DZ 58% Dichorionic Fused placentas MZ 14% DZ 42% Monochorionic Diamniotic MZ 63% DZ 0% Monochorionic Monoamniotic MZ 4% DZ 0%
Representative? • Test for “twin effects”: Include other family members (e.g. siblings of twins) • Look at resemblance in twins of mistaken zygosity (parents say DZ, testing says MZ)
Extended twin designs Twin and sibs: tests of special twin effects; increased power to detect Common environment, Non-additive genetic effects Twin and parents: genetic and cultural transmission, GE correlation, assortment
Individual differences in response to CBCL items on gender identity (3 point scale) Rather be of the other sex I am of the other sex van Beijsterveldt et al. Genetic and environmental influences on cross-gender behavior and relation to behavior problems: a study of Dutch twins at ages 7 and 10 years. Arch Sex Behav. 2006, 35(6):647-58
Multifactorial Threshold Model of Disease Multiple thresholds Single threshold unaffected affected normal mild mod severe Diseaseliability Disease liability
Genetic differences= differences in DNA sequence Human-Human 1:1000 = 0.1% Human-Chimp 1:100 = 1% Human-Mouse 1:8 = 15%
Sequence differences between individuals DNA amino acid
Resemblance between relatives caused by: • shared Genes (G = A + D) • environment Common to family members (C) Differences between relatives caused by: • non-shared Genes • Unique environment (U or E)
Punnett square Genetics explains both the resemblances and the differences of family members (e.g. sibs). Distribution of phenotypes in offspring of two heterozygous parents (AaBb). (2 genes (A & B) with additive allelic effects). K Mather, Biometrical Genetics, Dover Publ, 1949
what is a gene? In 2003, estimates from gene-prediction programs suggested there are 24,500 or fewer protein-coding genes. The Ensembl genome-annotation system estimates them at 23,299. Perhaps the biggest obstacle to gene counting is that the definition of a gene is unclear. Is a gene: • a heritable unit corresponding to an observable phenotype • a packet of genetic information that encodes a protein • a packet of genetic information that encodes RNA • must it be translated ? • are genes genes if they are not expressed ? TK Attwood: The Babel of Bioinformatics, Science, 290:471, 2000
C D E A A gene is a latent factor Unique Environment Shared Environment Additive Genetic effects Dominance Genetic effects c a e d Phenotype P = eE + aA + cC + dD (plus epistasis, assortment, GE interaction, ….)
Both continuous and categorical variables Systematic approach to hypothesis testing Tests of significance (for effects of G, D, C) Can be extended to: More complex questions Multiple variables Other relatives Structural equation modeling
ACE Model for univariate twin / sib data 1 MZ=1.0; DZ/sib=0.5 E C A A C E e c a a c e PT1 PT2
Heritability estimates in males and females (ANTR twin data) Boomsma et al., 2002, Nat Review Genet Genes Shared environment Unique environment
3 Stages of Genetic Mapping • Are there genes influencing this trait? • Genetic epidemiological studies • Where are those genes? • Linkage analysis • (look for quantitatve trait loci: QTL) • What are those genes? • Association analysis
rMZ = rDZ = 1 rMZ = 1, rDZ =0.5 E E ^ rMZ = 1, rDZ = C C e e A A c c a a Q Q q q Twin 1 Trait X Twin 2 Trait X π (QTL correlation) is estimated from IBD (identity by descent) data
IBD data: A fully informative mating marker QTL offspringIBD = 2 distance Sib1ACBD Sib2ACBD offspringIBD = 1 Sib1ACBD Sib2ADBC offspringIBD = 0 Sib1AC Sib2BD mother father D A B C X Q? Q? Q? Q?
Linkage: tracking anonymous DNA markers close to genes of interest in families / sibling pairs. • “blind” search, low power • new genes, new mechanisms • Genetic association (based on linkage disequilibrium): direct comparison of regulatory and coding sequences in candidate genes (or markers close to candidate genes). • high power, high type I/II error rate • which candidates ? • Genome wide (GWA)
Anxiety (NL; longitudinal survey data) 14 Middeldorp et al, Molecular Psychiatry, 2008
Neuroticism (endophenotype for depression and anxiety) Data from the Netherlands and Australia (Wray et al. (Arch General Psychiatry, in press)) • 19,635 sibling pairs with data for neuroticism up to five times over a period of up to 22 years. • 5,424 sib pairs genotyped with microsatellite markers; pairs concordant or discordant with respect to extreme neuroticism scores were genotyped preferentially. • 38% (AU) and 51% (NL) of parents were genotyped. • The average distance between markers was 8.2 cM (Australia) and 11 cM (Netherlands). • Non-parametric linkage analysis in Merlin-Regress for mean neuroticism score across time. • Empirical LOD thresholds for suggestive linkage derived from Merlin – simulate.
Neuroticism Netherlands and Australia 90 cM on chr 2 105 cM on chr 14 130 cM on chr 8 115 cM on chr 18
Linkage Analysis • Models the covariance structure among family members • Marker sharing between relatives • Identifies large regions • Include several candidates • Complex disease • Scans on sets of small families popular • No strong assumptions about disease alleles • Low power • Limited resolution
Association • Models “mean” values • Looks for correlation between specific alleles and a phenotype (quantitative trait value, disease risk) • E.g. cases and controls (affected / unaffected) • Or high and low scoring Ss
Association • More sensitive to small effects • Need to “guess” gene/alleles (“candidate gene”) or be close enough for linkage disequilibrium with nearby loci (GWA: Genome Wide Association) • May get spurious association (“stratification”) – need to have genetic controls to be convinced • May get too many “positive” results (if the number of tests is large)
Types of Twin Studies I Classical MZ -DZ comparison: • age differences in heritability • sex differences in heritability • genotype x environment interaction • causal models • multivariate genetic analyses
Genotype x Environment interaction: Heritability of Disinhibition as a function of religious upbringing Religious upbringing Non-Religious upbringing D.I. Boomsma et al. (1999) Twin Research 2, 115-125
IQ heritability (gene x age interaction) Genes Common environment Unique environment
E G VAR 1 VAR 2 VAR 3 E E G G G E Multivariate analysis: Genetic factor model: do the same latent factors influence multiple traits ?
Why do we use the average sib values of ra = 0.5 and rd = 0.25 when we can estimate the (almost) exact values for each sib pair from marker data ? Classical twin design revisited: Heritability estimation without MZ twins
Types of Twin Studies II • Co-twin control study • Extended twin study including: parents: assortative mating cultural transmission siblings: social interaction MZ offspring: maternal effects
Monozygotic Twins Discordant for a trait: Identical genomes; differences caused by Environment? • Different chromosome constitutions because of post-zygotic non-disjunction: e.g. MZ male-female 46,XY - 45,XO • Differential methylation (imprinted genes) • CNV (copy number variation) • Skewed X chromosome inactivation in female MZ twins • Differential trinucleotide repeat expansion • Post-zygotic mutation • Prenatal differences • Postnatal environmental differences Martin N, Boomsma DI, Machin G. (1997) Nature Genetics
“environmental” factors in MZ twins discordant for Attention problems Smoking mother during pregnancy discordant: 38% (11/29) concordant affected: 38% (8/21) n.s. control: 14% (10/73) sign. Placentation: % of pairs with 2 placenta’s in this study: discordant: 38% (10/26) concordant affected: 15% (3/20) sign. control: 13% (13/68) sign. Birth weight affected twin: 2425 g unaffected co-twin: 2580 g sign. Time in incubator affected twin: 11 days unaffected co-twin: 7 days sign.
fitted model Data 0.008 0 10 Voxel intensity - mean 0 t-value 0.008 H L H L H L H L H L H L H L H L H L H L 1 2 3 4 5 6 7 8 9 10 Discordant twin pairs MZ twins discordant for depression risk:Gray Matter high risk twin < GM low risk twin P A Right parahippocampus (maximum t =8.08, p < 0.0001 at x=24,y=-34, z=-6 in MNI space) p<0.001, min 50 voxels Right parahippocampus is smaller in the high risk twin from discordant MZ pairs (De Geus et al., 2007)
Types of Twin Studies III • Genotyping of MZ twins: - to detect variability genes - to estimate penetrance • Genotyping of DZ twins to detect linkage and association
Gene – environment interaction in GWA • Differences within MZ pairs: (mainly) function of Environmental exposure • Are differences within pairs a function of genotype? • i.e. is sensitivity to the environment a function of genotype?