Download
1 / 7
70 likes | 242 Views
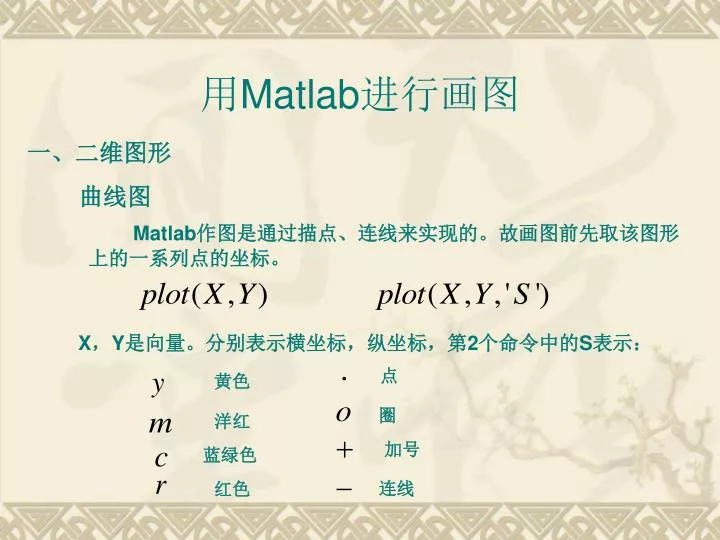
用 Matlab 进行画图. 一、二维图形. 曲线图. Matlab 作图是通过描点、连线来实现的。故画图前先取该图形 上的一系列点的坐标。. X , Y 是向量。分别表示横坐标,纵坐标,第 2 个命令中的 S 表示:. 点. 黄色. 圈. 洋红. 加号. 蓝绿色. 连线. 红色. 例 1 :求在区间 [0 , 2*pi] 画 sin ( x ). 解. 例 2 :求在区间 [0 , 2*pi] 用红线画 sin ( x ),用绿线画 cos ( x ). 解. 符号函数画图:.

E N D
用Matlab进行画图 一、二维图形 曲线图 Matlab作图是通过描点、连线来实现的。故画图前先取该图形 上的一系列点的坐标。 X,Y是向量。分别表示横坐标,纵坐标,第2个命令中的S表示: 点 黄色 圈 洋红 加号 蓝绿色 连线 红色
例2:求在区间[0,2*pi]用红线画sin(x),用绿线画cos(x)例2:求在区间[0,2*pi]用红线画sin(x),用绿线画cos(x) 解
符号函数画图: 表示在默认区间-2*pi<x<2*pi绘制f=f(x)的函数图 表示在a<x<b绘制显函数f=f(x)的函数图 表示在区间xmin<x<xmax和ymin<y<ymax绘制隐函数f(x,y)=0的函数图 表示在区间tmin<t<tmax绘制参数方程x=x(t) ,y=y(t)的函数图
例3:求在区间[0,2*pi]画sin(x)的图形 解 例4:求在区间[0,pi]画x=(cos(t))^3, y=(sin(t))^3的图形
二、三维图形 一条曲线图 X,Y,z分别表示横坐标,纵坐标和函数值,S表示颜色、线型 例1:求在区间[0,10*pi]画出参数曲线x=sin(t), y=cos(t),z=t. 解
习题 1、求在区间[-2*pi,2*pi]画出tanx,用红色表示 2、求在 [-2,0.5],[0,2上]画出隐函数e^x+sinxy=0的图形 3、P47