Download
1 / 12
120 likes | 201 Views
Analysis of Service Related Contributory or Causative Factors of Subway Rail Rage. February 2, 2008 by R. Washington. Research Objective. Research Problem Determine if there is a correlation between service related subway incidents and violence against employees. Goal

E N D
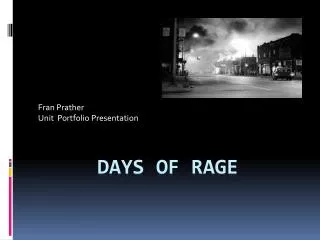
Analysis of Service Related Contributory or Causative Factors of Subway Rail Rage February 2, 2008 by R. Washington
Research Objective • Research Problem • Determine if there is a correlation between service related subway incidents and violence against employees. • Goal • Identify which service performance measures can be used to determine the likelihood of violence. • Perform analytical data analysis in search of trends and patterns. • Significance • Establishing cause-effect relationship can: • Allow for reactive measures • Improve employee safety • Minimize service and employee downtime • Minimize legal actions taken by customers and employees
Workplace Violence and Harassment • Incidents where persons are abused, threatened or assaulted in circumstances related to their work, involving an explicit or implicit challenge to their safety, well-being and health. • Violence can take a number of forms, including physical acts, abusive verbal and nonverbal communication, intimidating and bullying, exclusion, sexual harassment, and stalking.
Types of Workplace Violence • External Violence • Acts done by intruders to an organization who have no legitimate relationship with the organization. (Vandalism and acts of trespass). • Service-Related Violence • “Aggressive acts by customers” and can be used to describe the type of violence perpetrated against workers in the rail industry by passengers. (Mental illness, intoxication or public frustration over wait times and poor service). • Internal Violence • Acts done by management, employees, former employees, or those with an employment-based connection to the workplace. (Bullying, slander, gossip, rumors, social isolation)
Job-descriptive tasks Handling of money and fares Dealing with public (often frustrated) Working in a unsheltered environment Creating wait times Enforcing fares Dealing with complaints about service Factors in Violence • Nonfatal Assaults • hitting • kicking • beating • Pinching • scratching • biting • stabbing • shooting • Panic bar door • Trouble lights • Geographic locating devices • Train delay messaging systems • Preventive Strategies • Closed-circuit cameras • alarms • Two-way mirrors • Card-key access systems
Scenario A passenger’s frustration builds while waiting for a train that has been delayed. Upon it’s arrival, the train crew informs the customers of further extensive delays. The customer’s vented displeasure over the perceived poor service escalates from a heated verbal exchange to shoving match and threats of further physical harm.
High risk of assaults Average risk = 1.2% High risk of threats Average risk = 1.5% Security and protective services (11.4%) Nurses (5.0%) Care workers (2.8%) Public transport (2.8%) Catering/hotels/restaurants (2.6%) Other education and welfare (2.6%) Teachers (1.8%) Retail sales (1.8%) Management and personnel (1.7%) Leisure/service providers (1.7%) Other health professionals (1.4%) Public transport (5.6%) Security and protective services (5.3%) Other health professionals (4.0%) Retail sales (3.5%) Nurses (3.1%) Management and personnel (2.6%) Other education and welfare (2.3%) Catering/hotels/restaurants (2.0%) Teachers (2.0%) Cashiers/bank managers/money lenders (2.0%) Leisure/service providers (1.9%) Violence at WorkplaceOccupation Survey (UK, Sweden)
Current Status • Data Extraction Criteria: • Occurrences of assault or threats • Other incidents at that station or on connecting train lines. • Other incidents within a 5 hour window. • Develop algorithm to identify relationship between service delays and violence against employees. • Validate algorithm against text details. • Perform data Mining to identify hidden relationships.
References [1] Violence, Harassment, and Bullying at Work: How Does the Australian Rail Industry Compare and What Can Be Done?, www.nctr.usf.edu/jpt/pdf/JPT%208-3%20VanBarneveld.pdf [2] Workplace Violence, www.twu.org/default.asp?contentID=684 [3] When passengers explode, Smith, Carla, Report / Newsmagazine (Alberta Edition); 02/07/2000, Vol. 26 Issue 47, p42, 3/4p, 1c [4] Crime Reduction Toolkits: Violence at work, www.crimereduction.homeoffice.gov.uk/toolkits/br020304.htm [5] Japan Today–Kuchikomi – Train commuter rage still increasing, www.japantoday.com/jp/kuchikomi/498/all