Download
1 / 22
220 likes | 334 Views
The Supergrid: 100% Renewable Electricity Supply for Europe and its Neighborhood Optimal sustainable solution for climate protection: Transfer to US-American conditions. Dr.-Ing. Dipl.-Phys. G. Czisch. preliminary questions:. Is it possible to come to a totally renewable electricity supply ?

E N D
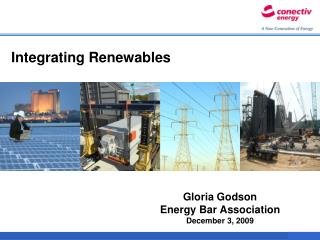
The Supergrid: 100% Renewable Electricity Supply for Europe and its NeighborhoodOptimal sustainable solution for climate protection: Transfer to US-American conditions Dr.-Ing. Dipl.-Phys. G. Czisch preliminary questions: Is it possible to come to a totally renewable electricity supply? (Potentials, Technology, Temporal Production Behavior) YES Can we afford that? (Cost) How could that work in an optimal case? Utilisation of the renewable potentials for a common electricity supply interconnected within a strong international grid => affordable supply Important steps to come there G. Czisch, Transnational Renewables Consulting (TNRC), Stanford, 20110113
Electricity Production with Hydropower Storage Type River Runoff Type Photo source, VSE G. Czisch (TNRC), Stanford, 20110113
> 1 Month EU-consumption Storage Hydro Power in Europe:Rated Power, Storage Capacity and Annual Energy Production G. Czisch (TNRC), Stanford, 20110113
Wind Energy Photo source: http://www.nrel.gov/data/pix/searchpix.cgi G. Czisch (TNRC), Stanford, 20110113
4000 3500 3000 2500 2000 1500 1000 80 60 40 20 0 -20 -40 -60 -80 -150 -100 -50 0 50 100 150 Mean Annual Production of 1.5 MW Variable Speed Wind Turbines (HH = 80 m) in Full Load Hours [FLH] Mean Annual Production 1979 –1992 [FLH] Meteorological data: ECMWF, ERA-15, 1979-1992G. Czisch (TNRC), Stanford, 20110113
80 60 40 20 0 -20 -40 -60 -80 2.0 1.8 1.6 1.4 1.2 1.0 0.8 0.6 0.4 Production Ratio JUL/JAN -150 -100 -50 0 50 100 150 Comparison of the Average Electricity Production (Jul Jan) from Wind Energy (Monthly Mean of 15 Years) Met.Data: ECMWF, ERA-15, 1979-1992G. Czisch (TNRC), Stanford, 20110113
EU & Norway 2700 FLH 400 TWh At 0.29 MW/km2 North Russia & West Siberia 3100 FLH 1100 TWh At 2.4 MW/km2 Kazakhstan 2600 FLH 550 TWh At 2.4 MW/km2 Southern Morocco 3400 FLH 400 TWh At 2.4 MW/km2 Mauritania 3000 FLH 320 TWh At 2.4 MW/km2 Mean Annual Production of 1.5 MW Variable Speed Wind Turbines (HH = 80 m)on Land Sites in Europe and its Neighbourhood Electricity Demand 1998 UCTE & NODEL: 2100 TWh Potential Wind Energy Prod. on land sites with more than 1500 FLH at 4 – 8 MW/km2: 120 000 – 240 000 TWh Mean Prod. at this sites: 2050 FLH Take the best: => 0.4% of the area for 4000TWh . Meteorological data: ECMWF, ERA-15, 1979-1992 G. Czisch (TNRC), Stanford, 20110113
Monthly Mean Electricity Production of Wind Power within Selected Favourable Regions at Land Sites and Electricity Demand Meteorological data: ECMWF, ERA-15, 1990 G. Czisch (TNRC), Stanford, 20110113
Monthly Mean Electricity Production of Wind Power within Selected Favourable Regions at Land Sites and Electricity Demand Meteorological data: ECMWF, ERA-15, 1990 G. Czisch (TNRC), Stanford, 20110113
Monthly Mean Electricity Production of Wind Power within Selected Favourable Regions at Land Sites and Electricity Demand Meteorological data: ECMWF, ERA-15, 1990 G. Czisch (TNRC), Stanford, 20110113
Transmission of Electricity Photo source: http://www.nrel.gov/data/pix/searchpix.cgi G. Czisch (TNRC), Stanford, 20110113
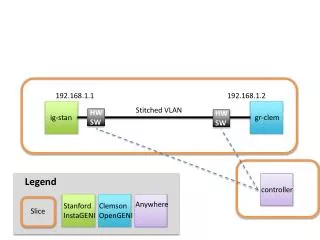
Some Estimated Maximum Net Transfer Capacities within UCTE and to its Neighbours in Winter 2004/2005 [MW] 1300 UCTE NORDEL UKTSOA ATSOI 3360 2520 High-Voltage-Direct-Current (HVDC) Transmission is a state-of-the-art technology able to transport elctricity over far distances with low losses and for low costs 2000 1000 1400 1400 400 400 Source of map: ETSO; Source of Data: ETSO G. Czisch (TNRC), Stanford, 20110113
Right 0f WayConventional 400 kV AC or new Supergrid with ±800 kV DC? 13 GW transmission capacity With conventional AC, 400 kV double system 520 m Or 13 GW transmission capacity With newest DC, ±800 kV HVDC double bipol 64 m G. Czisch (TNRC), Stanford, 20110113
Mean Annual Production of 1.5 MW Variable Speed Wind Turbines (HH = 80 m)on Land Sites in Europe and its Neighbourhood Electricity Demand 1998 UCTE & NODEL: 2100 TWh Potential Wind Energy Prod. on land sites with more than 1500 FLH at 4 – 8 MW/km2: 120 000 – 240 000 TWh Mean Prod. at this sites: 2050 FLH Meteorological data: ECMWF, ERA-15, 1979-1992 G. Czisch (TNRC), Stanford, 20110113
Cost Calculation for Wind Energy from Far Distant Regions Comparison with Germany Onshore Wind Power: Average Utilisation » 1600 VLh Cost of Electricity » 6,5€c/kWh G. Czisch (TNRC), Stanford, 20110113
HVDC-System Population 1.1 billion Inhabitants Electricity Consumption 4000 TWh/a Largest Distance 8000 km Northwest-Siberia South-Mauritania Potential Common Electricity System G. Czisch (TNRC), Stanford, 20110113
not allowed Annual Electricity Production by Type with CollectiveDemand, Transport, Surplus and Costs of Electricity Base Scenario: Today's Costs for all Components Today's Costs for all Components Only Technology Available Now G. Czisch (TNRC), Stanford, 20110113
Cost of Electricity (CoE) for Base Scenario (BS)and National Economies • Cost of Electricity Production in Base Scenario (including: Production, HVDC Transmission and Storage) CoE @ 4.6 €ct/kWh • Cost of Electricity Production in Base Scenario (including: Production, HVDC Transmission and Storage) CoE @ 4.6 €ct/kWh • Relation of Costs to National Income of EU-15 & Norway S CoE @ 1.1 % of GDP • Today‘s Expenses for Electricity@2.2 % of GDP(Germany today > 3%) • Thereof for Production @0.8 % of GDP • Costs difference BS Today @0.3 % of GDP • Further Progress in Renewable Technology => Cost Reduction > 30% • => A future renewable electricity supply could produce cheaper electricity than our current conventional system. • Cost of Electricity Production in Base Scenario (including: Production, HVDC Transmission and Storage) CoE @ 4.6 €ct/kWh • Relation of Costs to National Income of EU-15 & Norway S CoE @ 1.1 % of GDP • Today‘s Expenses for Electricity@2.2 % of GDP(Germany today > 3%) • Thereof for Production @0.8 % of GDP • Costs difference BS Today @0.3 % of GDP • Further Progress in Renewable Technology => Cost Reduction > 30% • Cost of Electricity Production in Base Scenario (including: Production, HVDC Transmission and Storage) CoE @ 4.6 €ct/kWh • Relation of Costs to National Income of EU-15 & Norway S CoE @ 1.1 % of GDP • Today‘s Expenses for Electricity@2.2 % of GDP(Germany today > 3%) • Thereof for Production @0.8 % of GDP • Costs difference BS Today @0.3 % of GDP • Cost of Electricity Production in Base Scenario (including: Production, HVDC Transmission and Storage) CoE @ 4.6 €ct/kWh • Relation of Costs to National Income of EU-15 & Norway S CoE @ 1.1 % of GDP • Today‘s Expenses for Electricity@2.2 % of GDP(Germany today > 3%) • Thereof for Production @0.8 % of GDP • Cost of Electricity Production in Base Scenario (including: Production, HVDC Transmission and Storage) CoE @ 4.6 €ct/kWh • Relation of Costs to National Income of EU-15 & Norway S CoE @ 1.1 % of GDP • Today‘s Expenses for Electricity@2.2 % of GDP(Germany today > 3%) • Cost of Electricity Production in Base Scenario (including: Production, HVDC Transmission and Storage) CoE @ 4.6 €ct/kWh • Relation of Costs to National Income of EU-15 & Norway S CoE @ 1.1 % of GDP • Prices at EEX: German-Baseload-Cal-07 already exceeded 6 €ct/kWh G. Czisch (TNRC), Stanford, 20110113
Annual Electricity Production by Type, and Costs of Electricity different Scenarios Biomass 5500 11 Hydrogen Fuel Cell 5000 10 Energy Towers 4500 9 Geothermal PP 4000 8 GFCC PP 3500 7 SEGS 3000 6 Cost of electricity [€ct/kWh] Production [TWh] Photovoltaic 2500 5 Hydropower 2000 4 Wind Land 1500 3 Wind offshore 1000 2 El. Costs D-Dk 500 1 El. Costs Ø 0 0 El. Consumption BS 1/8 PVIC 1/16 PVIC BS + ET BS only Cable SEGS 1/2 SFC 0% Trans. + FC 100% LP 10% GFCC BS + Hydrop. at Inga 0% Trans. 15% GFCC SEGS 2/5 SFC 2/3 SC G. Czisch (TNRC), Stanford, 20110113
Basic conclusions from the scenarios • There are enough renewables for all needs. • The bigger the catchment area the better temporal behaviour. • Backup and storage are existent. • The grid must be reinforced. • Costs for backup and HVDC – lines would not dominate. • Also the cost of electricity of a fully renewable electricity supply would be quite reasonable. • Now politics and economy are responsible, now they must act! G. Czisch (TNRC), Stanford, 20110113
International Electricity Supply With Renewable Energies:What is happening towards the Renewable Supergrid 2007 the Swiss parliament discusses the cooperation with Germany and France and 2008 the German ministries of economy discuss cooperation with Switzerland to export offshore wind energy to Switzerland and get backup from Swiss hydropower. 2008 the 17th Baltic Sea Parliamentary Conference (BSPC) promotes the development of a European ultra-high voltage DC transmission network for greater use of renewable energies. 2008 as a step towards the Mediterranean union the EU discusses the import of renewable energies from North Africa. Article 9 of the DIRECTIVE 2009/28/EC of the European Parliament and of the Council on the promotion of the use of energy from renewable sources regulates how renewable electricity could be imported from non EU countries to the EU. In June 2009 Desertec Industrial Initiative – (DII) was founded – amongst the Founders were Munich Re, Siemens, Deutsche Bank the German Ministry for Economy and the Club of Rome and announced to invest 400 Billion € till 2050 in the export of solar electricity from Africa to Europe. 2010 EU energy Commissioner Günther Oettinger promotes a European feed-in-system and feed-in-tariffs which also aim to realize renewable imports from Africa. G. Czisch (TNRC), Stanford, 20110113
Climate change is often seen as one of the biggest challenges mankind has ever been faced with. But the chances are that it is negligence rather than the practical infeasibility of the problem which will cause us real trouble. Thank you for your attention Gregor Czisch Transnational Renewables Consulting (TNRC) gc@tnrc.de +49-163-826-7921