Download
1 / 22
220 likes | 303 Views
Applied Fuzzy Grey Autoregressive Model for Forecasting the Amount of Taiwan’s Internet Users. Ruey-Chyn Tsaur Department of Finance Hsuan Chuang University. 1. Introduction.

E N D
Applied Fuzzy Grey Autoregressive Model for Forecasting the Amount of Taiwan’s Internet Users Ruey-Chyn Tsaur Department of Finance Hsuan Chuang University
1. Introduction • The time series model is a popular method which is successfully being used in the forecasting of economic, marketing, or social problems and others. • The grey model GM(1,1) was defined and introduced in management and engineering applications to solve limited time series data.
An application that uses fuzzy regression to time series analysis was presented by Watada . • Tseng et al. proposed the fuzzy ARIMA method which uses the fuzzy regression method to fuzzify the parameters of the ARIMA model. • Tsaur has developed a fuzzy grey regression model for analyzing limited time series data by hybridizing the fuzzy set theory into the grey model GM(1,1).
The fuzzy grey regression model cannot fit all types of data which collected over time tend to exhibit trends observations in different time periods that are autocorrelated. • In order to minimize uncertainty and to identify the correlation in successive observations, the fuzzy grey autoregressive model was constructed to forecast the amount of internet users in Taiwan.
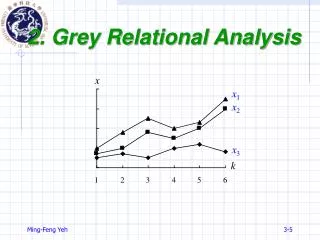
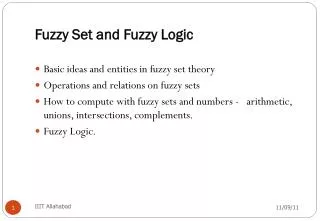
2. Reviewing the Forecasting Model under Limited Data • THE GREY MODEL GM(1,1) • FUZZY REGRESSION MODEL • FUZZY GREY REGRESSION MODEL
2.1 Fuzzy Grey Regression Model • Definition 1. The fuzzy grey regression model with crisp-input and fuzzy-output value is defined as , where the fuzzy parameters and are fuzzy sets on the product space of the parameter for mapping the input AGO time series of the fuzzy independent variable to the fuzzy-output value of the fuzzy dependent variable .
3. Fuzzy Grey Autoregressive Model • Definition 2 The qth-order fuzzy grey autoregressive model (FGAM) with crisp input and fuzzy output value is defined as , , where the fuzzy parameters , and are fuzzy sets on the product space of parameter for mapping the input AGO time series and the lagged values of the independent variables and to the fuzzy-output value of fuzzy dependent variable , .
4. Forecasting the Amount of Taiwan’s Internet Users Table 1. The collected Internet Users (Unit: Thousand)
Table 3 The Forecasting Values By Different Time Series Models (Unit: Thousand)
Table 4. The Forecasting Interval by Fuzzy Grey Autoregressive Models (Unit: Thousand)
5. Conclusion • Based on the fundamental concepts of the fuzzy grey regression model and the time series model, this study combined the advantages of these two methods and presented a new method fuzzy grey autoregressive model. • The fuzzy grey autoregressive model appears to be the most appropriate tool based on the following two primary advantages: (a) It provides the decision makers with both the best possible and the worst possible situations. (b) The number of required observations is limited.