Download
1 / 28
280 likes | 507 Views
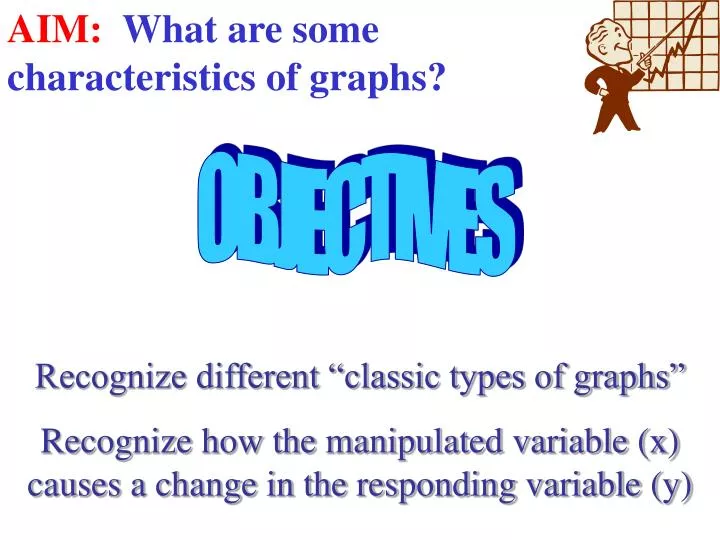
AIM: What are some characteristics of graphs? . OBJECTIVES. Recognize different “classic types of graphs” Recognize how the manipulated variable (x) causes a change in the responding variable (y). AIM: What are characteristics of of line graphs?.

E N D
AIM: What are some characteristics of graphs? OBJECTIVES Recognize different “classic types of graphs” Recognize how the manipulated variable (x) causes a change in the responding variable (y)
AIM: What are characteristics of of line graphs? Vocabulary Best fit graph Inversely (indirectly) proportional Directly proportional
DEFINITION: • a LINE GRAPH is a diagram which shows how changing one variable • (the manipulated variable) X, • causes a second (or responding) variable Y to also change in response.
EXAMPLE: Number of Frog Croaks • Air Temp # of Croaks per minute • 22 12 • 23 14 • 24 15 • 25 16 • 26 17 • 31 21 • 32 26
GRAPH IT! Don't forget your labels and the title!
Step Two: label your axis: 30 20 # Croaks per per minute 15 10 22 23 24 25 26 27 28 29 30 31 32 AIR TEMPERATURE Degrees C
Step Three: Plot your Points 30 20 # Croaks per per minute 15 10 22 23 24 25 26 27 28 29 30 31 32 AIR TEMPERATURE Degrees C
Step Four: Draw your Line 30 20 # Croaks per per minute 15 10 22 23 24 25 26 27 28 29 30 31 32 AIR TEMPERATURE Degrees C
Step Four: Draw your Line 30 20 # Croaks per per minute 15 10 22 23 24 25 26 27 28 29 30 31 32 AIR TEMPERATURE Degrees C
Step Four: Draw your Line 30 20 # Croaks per per minute 15 10 22 23 24 25 26 27 28 29 30 31 32 AIR TEMPERATURE Degrees C
Line Graphs: Allow you to estimate trends: “As temperature increases what is happening to the number of croaks?” 25 20 # Croaks per per minute 15 10 22 23 24 25 26 27 28 29 30 31 32 AIR TEMPERATURE Degrees C
Line Graphs: Allow you to estimate trends: “As temperature decreases what is happening to the number of croaks?” 25 20 # Croaks per per minute 15 10 22 23 24 25 26 27 28 29 30 31 32 AIR TEMPERATURE Degrees C
Three Types of Line Graphs • Best Fit • Direct • Indirect
Line Graphs “Best Fit Graphs” • Normally, best first graphs are only done when the directions explicitly indicate to construct a “best fit graph” AIM: What is a line graph?
Line Graphs: Inverse Proportional vs. Directly Proportional Graphs!
GRAPH THIS: Hours of Study Grade .5 50 1 75 1.5 85 2 90 3 100
GRAPH THIS: Hours of TV Grade 1 100 2 90 3 85 4 75 5 60
What is the difference between these two graphs? Hours of TV vs. Grade As X increases, Y decreases Slopes Downward Indirectly or Inversely Proportional As X increases, Y increases Slopes Upward Directly Proportional
AIM: What is a Line Graph? Class ACTIVITY: Creating Line Graphs page 67
Homework: INTERNET QUESTIONS AIM: What is a line graph?