Download
1 / 23
230 likes | 353 Views
Chemicals and Water workshop EEA, Copenhagen 06-07 2010 Levels in Marine Waters Norman Green, Birger Bjerkeng (NIVA/ETCw). Policy Methods Results. EIONET data – marine sediment and biota. Considerations:

E N D
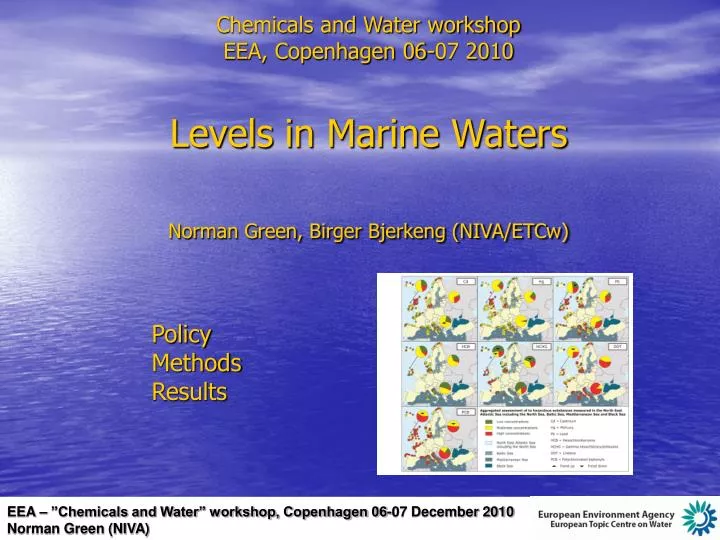
Chemicals and Water workshopEEA, Copenhagen 06-07 2010Levels in Marine WatersNorman Green, Birger Bjerkeng (NIVA/ETCw) PolicyMethodsResults
EIONET data – marine sediment and biota • Considerations: • Contaminants – persistent, bioaccumulates and toxic, also endocrine disrupting, carcinogenic and injury to reproductive system • Data availability – spatial and temporal [little or no data from water column] from conventions and member states • Sediment – surficial, deposition/erosion areas • Organisms of relevance – widespread, abundant, seafood, indicators exposure
Some policy principles: • Precautionary principle based implementation (WFD introduction §11 and 44; MSFD introduction §27 and 44; EQSD introduction §2) • Selection of contaminants: • To a large degree based on characteristics of persistence, accumulation in biota or toxicity (so called ”PBT” characteristics, EU category I); • To a lesser degree on carcinogenic or mutagenic characteristics or risk to reproduction system (so called ”CMR” characteristics, EU category II); • But also suseptable long range transportation (LRT), and; • Discharges of a large and constant nature but that breakdown quickly • The list over relevant substances is re-evaluated regularly and can be expanded (e.g. EQSD Annex III)
EQSD substances • Concerns rivers, lakes, heavily modified water bodies (HMWB), coastal waters including territorial waters. • 33 Priority Substances or groups of substances (PS) includes chemical status: • 13 Priority Hazardous Substances (PHS) to be phased out by 2020 • 20 other Priority Substances progressive reduction • 8 other substances or groups of substances with EQS • 12 other substances which are to be considered included as Priority Substances by 2011 and assessed under ecological status (EQSD Annex III) • Short term goal: obtain Good Status by 2015 • Long term goal: cessation or phasing-out of discharges, emissions and losses, with the ultimate aim of achieving concentrations in the marine environment near background values for naturally occurring substances and close to zero for man-made synthetic substances
33 Priority substances 15 Biocides 4 PAHs 3 Solvents 4 Heavy metals 2 Precursors 2 Surfactants 2 Flame retardants 1 Plasticiser ”Other” substances (8) Annex III substances (12) TBT
EQSD and EQS • Earlier, EQS concerned only substances in water phase • EQSD sets some EQS for biota and opens for alternative use of sediment and biota (2008/105/EC Art. 3): • EQS defined for Hg, HCBD, HCB in ”prey tissue” • NB: EQS vs Klif Cl. I (ppb v.v.): Hg = 20”prey tissue” vs 40blue mussell and 100cod muscle • NB: EQS vs Klif Cl. I (ppb v.v.): HCB = 10”prey tissue” vs 0.1blue mussell and 20cod muscle • EQS for other matrices/substances but must provide the same level of protection as EQS for water • Annual monitoring unless technical knowledge and expert judgement justify another interval • Provide reasons and basis for alternative approach • Must at least ensure that there is no significant increase in levels or classification (2000/60/EC Art. 4WFD 8 e.g. art. 4 and 7) and MFSD (art. 14), and implied in the EQSD (art. 3). This is one of the strongest arguments for maintaining long time series.)
EEA’s CSI040 indicator Hazardous Substances in Marine OrganismsMethodology (I) Only biota data are currently used in the indicator • Values converted to preferred basis (wet, dry., lipid) (may lead to loss of data) • Each time series (Determinand*Tissue*Station)is aggregated to median concentration per year • Further analysis is done on log-transformed values,results back-transformed to concentrations
CSI040 Indicator –methodology (II) • For each time series (Station*Tissue*Determinand): • Trend assessment by regression of log-transformed medians on year • If all medians are well-defined: ≥7 years: Smooth curve by local weighted regression(LOESS, 7 year window, minimum 3 points) • Dominant trend last 10 years (5 % sign. level) 3-6 years: linear regression • ≥4 years: Mann-Kendall trend (modified to handle low-high range medians) • Combining trend results (5 % significance level) • Classification as:Up/ Down/ Not significant / Not applicable
CSI040 Indicator –methodology (III) • Chemical status assessed for each time series by current levels: • ≥2 years: Regression fit for last year • 2 years: Average of median values • 1 year: No classification Upper 95 % confidence limit for the estimate compared with low/high classification levels; three classes: Green <Low Yellow within Low – High range Red >High PCBs: combined assessment(consistent trend, next worst classification)
CSI040 Indicator –methodology (IV) • For each main region: • Tally of time series for each determinandand as sums across determinands according to • Time trend assessment: • Up • Down • Not significant (NS) • Not applicable (NA) too short time series) • Current level classification: • Green • Yellow • Red • Significant dominant trend direction in each level classand total over all level classes • Option: overall tally across regions and determinands
EIONET data: Biota data PCB alsoused in assessment,listed as substance subject to review
Possible additional matches between WFD list and EIONET data
CSI040 Hazardous substances in marine organisms - aggregated maps prepared by EEA, 2005-2008
SoE classification vs. WFD EQSNeed for harmonisation of SoE assessment and EQS levels(classification limits and selection of test values) Italicised values are approx. conversions: Wet:dry 5:1 Lipid:wet 40:100
Sediment data • Broader geographical coverage • Iceland, Ireland, United Kingdom, Norway, Denmark, Sweden, Estonia, Lithuania, (Latvia), Poland, Germany, Netherlands, Belgium, France, Portugal, Italy, Malta, Croatia, Greece, Romania, Turkey, • Longer time span • Many series back to at least 1990 Probably sufficient for assessment in some subregions
Large change since last submission Loads to northeastern Atlanticexample: cadmium Data gap Data available but not shown
Hazardous substances – gaps in knowledge Main gaps in knowledge, need for: • Better estimates of pathways, fate, levels, trends and effects • Better understanding of multiple exposure to HS • Better comprehension of the role of climate change • Need for consistent and reliable monitoring • Need for local knowledge to interpret changes • Need for remedial action plans and controls CSI 040 HS in marine organisms, example: lead norman.green@niva.no