Download
1 / 121
3.06k likes | 4.28k Views
Management Consulting Toolkit I. This is the first Management Consulting Toolkit in a series of 3 Toolkits. This Toolkit contains 15 core strategic and operational frameworks (listed below). There are over 100 instructional and template slides. Porter’s Five Forces Customer Experience

E N D
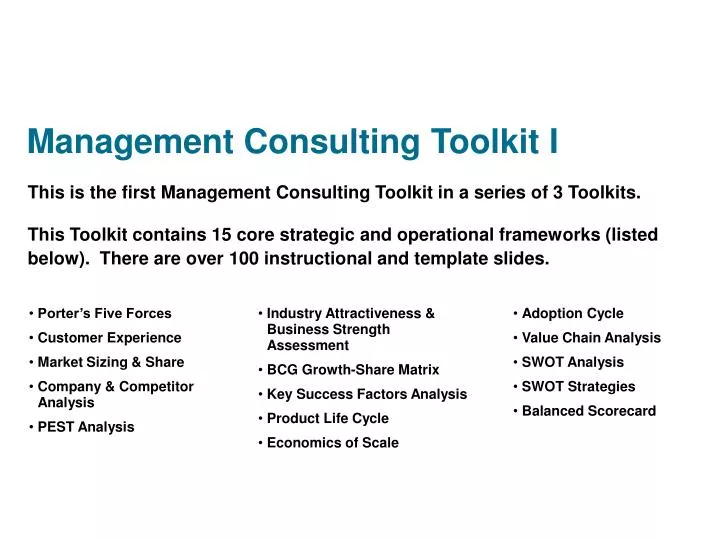
Management Consulting Toolkit I This is the first Management Consulting Toolkit in a series of 3 Toolkits. This Toolkit contains 15 core strategic and operational frameworks (listed below). There are over 100 instructional and template slides. • Porter’s Five Forces • Customer Experience • Market Sizing & Share • Company & Competitor Analysis • PEST Analysis • Industry Attractiveness & Business Strength Assessment • BCG Growth-Share Matrix • Key Success Factors Analysis • Product Life Cycle • Economics of Scale • Adoption Cycle • Value Chain Analysis • SWOT Analysis • SWOT Strategies • Balanced Scorecard
Contents FRAMEWORK SLIDE • Porter’s Five Forces 3 • Customer Experience 28 • Market Sizing & Share 34 • Company & Competitor Analysis 48 • PEST Analysis 58 • Industry Attractiveness & Business Strength Assessment 61 • BCG Growth-Share Matrix 67 • Key Success Factors Analysis 73 • Product Life Cycle 81 • Economies of Scale 88 • Adoption Cycle 94 • Value Chain Analysis 99 • SWOT Analysis 105 • SWOT Strategies 110 • Balanced Scorecard 114
Porter’s five forces – introduction Why We Use It What It Is • Porter’s five forces constitutes a framework for analysing a company’s environment (or industry structure): • Porter first structured the framework in his 1980 book Competitive Strategy. • Porter assumes that competition in an industry depends on five basic forces: • The collective strength of these forces determines the ultimate profit potential and allocation in the industry. • Assess attractiveness on the basis of competition in an industry. • Highlight areas in which industry trends may pose opportunities or threats. • Analyze where the company stands vis-a-vis the underlying causes of each competitive force. • To understand/diagnose levels of return. Potential Entrants Strengths & Limitations Threat of new entrants • Strengths: • Quite comprehensive framework. • Good starting point to understand key drivers and trends. • Limitations: • Very often used strictly qualitatively. Bargaining power of suppliers Industry Competitors Bargaining power of buyers Buyers Suppliers Rivalry Among Existing Firms Threat of substitute products or services Substitutes Source: M.E. Porter, Competitive Strategy, 1980, p. 4 Free Press.
Porter’s five forces 1. Potential new competitors Threat by new competitors 4. Suppliers Suppliers negotiation power 5. Customers Buyers’ negotiation power 2. Competitors in the industry Rivalry among existing companies 3. Substitution products Threat by substitution products
Porter’s five forces – potential insight/output • Several important economic and technical characteristics of an industry are critical to the strengths of each competitive force: Threat of New Entrants Competitive Advantage Barriers to entry: • Economies of scale (including shared resources) • Product differentiation (proprietary) • Capital requirements • Switching costs • Access to distribution channels • Cost disadvantages independent of scale • Government policy • Expected reaction of incumbent Lower Cost Differentiation Cost Leadership Differentiation Broad Competitive Scope Cost Focus Differentiation Focus Narrow Bargaining Power of Suppliers Intensity of Rivalry Bargaining Power of Buyers A supplier group is powerful when: • It is dominated by a few companies and is more concentrated than the industry it sells to. • There are no substitute products. • The industry is not an important customer. • Its products are important to the industry. • Products are differentiated or suppliers have built up switching costs. • It poses a credible threat of forward integration. Intense rivalry results from: • Numerous or equally balanced competitors • Slow industry growth • High fixed or storage costs • Lack of differentiation or switching costs • Capacity augmented in large increments • Diverse competitors • High strategic stakes • High exit barriers A buyer group is powerful when: • It is concentrated or purchases large volumes relative to seller sales. • The products represent a significant fraction of the buyers’ costs or purchases. • The products are standard or undifferentiated. • It faces few switching costs. • It earns low profits. • It poses a credible threat of backward integration. • The bought product is unimportant. • It has full information. Pressure from Substitute Products Exit Barriers • Search for products that can perform the same function. • Assess buyers’ propensity to substitute. Focus on those that: • Are improving their price performance trade-off compared with the industries products. • Require low switching costs. • Are produced by industries earning high profits. • Take offensive or defensive actions to create a defensible position against the forces: • Positioning the firm so its capabilities provide the best defence • Influencing the balance of forces through strategic moves • Anticipating shifts in the factors underlying the forces and responding to them L H Low, stable returns Low, risky returns L Entry Barriers High, stable returns High, risky returns H
The publishing industry has seen only modest increases in sales in recent years EXAMPLE Total U.S. printed media revenues, 1989-1999Includes both consumer and advertising spending • Newspaper and magazine revenue growth has been driven by price increases, as circulation has been flat to falling • Newspapers and magazines share of total advertisers’ spending has also fallen from 32% to 28% over the last five years • Book publishers have seen growth in book unit volumes, with stable prices: • Books remain a popular source for access to fiction and non-fiction despite a growing number of substitutes • Recent growth of discount stores has helped increase sales Total revenues CAGR • $ Billions 1989-1994 4.6% 1994-1999E 5.7% Newspapers Books Magazines 89 90 91 92 93 94 95E 96E 97E 98E 99E The internet provides an innovative new distribution medium that magazines and newspapers can use to recover readers and lure advertisers. Source: Veronis, Suhler & Associates; S&P Industry Survey Note: Magazine and newspaper spending includes both advertising and consumer spending
The stock market, unsure of publishing’s future role, is not rewarding print-focused players EXAMPLE Value of $100 invested in March 1985 The Wall Street appeal of online involvement could help publishers who proactively use the new distribution medium maa-88 maa-89 maa-90 maa-91 maa-92 maa-93 maa-94 maa-95 maa-85 maa-86 maa-87 Publishing companies must to transition to full media companies, expanding beyond print to distribute their products to be seen as long-term competitors. Source: Compustat Note: All dividends reinvested. Indices track independent, “pure play” print media companies in each print segment
Leaders in the PC business have changed as quickly as the need for computing power EXAMPLE U.S. Unit Market Share of top 10 competitors(quarterly changes in market share) U.S. UnitMarket Share CompanyX 70% CompanyX CompanyX 60% CompanyX 50% CompanyX CompanyX 40% CompanyX 30% CompanyX 20% CompanyX 10% CompanyX 0% 1Q 1993 2Q 1993 3Q 1993 4Q 1993 1Q 1994 2Q 1994 3Q 1994 4Q 1994 New entrants and industry consolidation are forcing competitors to continually redefine their business strategies.
Gross margins have declined as the PC becomes a commodity product EXAMPLE Average PC makers’ revenue spending Top PC makers’ gross margin, 1989-1994 $1.00 % Gross margin $0.76 $0.04 $0.13 $0.02 $0.05 Revenue Cost of goods R&D Mktg. & distribution SG&A Operating profit Taiwanese hardware manufacturers, such as Acer, have experienced 25% compound annual revenue growth since 1986 by being the lowest cost suppliers to the top PC makers worldwide.
Several factors determine the bargaining power of buyers A buyer group is powerful when: • It is concentrated or purchases large volumes relative to seller sales • Its purchases from the industry represent a significant fraction of the buyers’ costs or purchases • It purchases standard or undifferentiated products • Brand identification is low • Its switching costs are low • Its profits are low • It poses a credible threat of backward integration • Its purchases from the industry is unimportant for the quality of its products or services • It possesses full information These factors may change over time and alter buyer power.
Bookstores are the only channel with the ability to exert pressure on publishers EXAMPLE Publishers Primarily newspapers and magazines Primarily books Direct Distribution (subscription) Convenience Stores & Newsstands Other retail outlets Schools & Universities • BookstoresU.S. Retail Market Share, 1994 • Barnes & Nobles 17.3% • Borders-Walden 16.1% • Crown Books 3.2% • Books-a-Million 1.8% • Total retail market of $9.4 billion 38.4% • These large national stores played a central role in boosting book sales to record levels in 1994, but put pricing pressure on publishers • For newspapers and magazines the customer-base is more fragmented Limited bandwidth will slow book publishers’ ability to distribute products on-line, but could bypass bookstores through Internet-based mail-order services and other creative services.
Distinct distribution channels serve the two major different end-user segments EXAMPLE Channels Definitions Typical buyer Direct Sales Those sales made by a manufacturers’ sales force, agent, or representative Business Value-added channels System Integrators (SI) Provide customized value-added solutions for clients Value-Added Resellers (VAR) Offer unique, tangible solutions “off-the-shelf” to targeted customers Dealers The “traditional” computer dealer channel. Do not add unique value to the system but do offer some value in the form of support, training, or other services Computer Superstores Large, well-merchandized store fronts , with most revenue generated by computer-related sales Home users Mass Merchants Typically offer a wide range of products, including computer-related equipment Consumer Electronic Stores Offer a wide range of electronic merchandise, including computer-related items Mainstream channels Office Stores Retailers and resellers focusing on office supplies Mail Order Third-party computer sales that use telephone to perform all levels of sale Direct Response Direct telephone sales from manufacturers not using third parties Massive increase of home PC usage has increased the strength of the mainstream channel, especially retailers. Source: IDC and Merrin Information Services, Inc.
Substitute products exist • Substitutes place a ceiling on the product’s price • Identification: A product that performs the same function • Position vis-a-vis substitute products may be a matter of collective industry actions • Penetration by the substitute depends on: • Existence of substitutes • The price-performance trade-off • Tendency of purchasers to reach for substitutes • Switching costs • Risks of failure
Supply Chain pressures have encouraged publishers to explore non-print opportunities EXAMPLE New innovation As a substitute for … Print publishers are rushing into these substitutes to pre-empt a push from niche players.
Several substitute end-user devices look to compete with PCs for a share of internet hardware revenues EXAMPLE Substitutes to PC access will focus on specific applications, leaving a significant need for multi-functional PCs.
Paper companies’ strong leverage is pushing publishers to explore non-print options EXAMPLE Paper Companies North American Market Share,1994 Top 5Top 10 Books 51.2% 74.7% Magazines 56.7% 86.5% Newspapers 41.1% 64.4% Independent Printers Ink Suppliers Other Publishers • Many publishers and printers have seen the price of paper double in the first half of 1995 alone: • A world paper shortage has resulted from increased demand for paper-based information • North American paper producers have the option to sell to more lucrative foreign markets, leading to a sharp rise in North American exports • Foreign producers also prefer to sell to more lucrative markets • Even partial movement towards non-print media affords publishers greater bargaining power with conventional suppliers Many newspapers and magazines are already on the web, piloting the feasibility of an online presence. Source: Publishers Weekly
As hardware makers continue to look for ways to cut costs, suppliers’ leverage will increase EXAMPLE A high pace of innovation, combined with increased competition, will fuel an overall increase in supplier leverage.
Porter’s five forces – top tips • Do: • Define precisely the industry before conducting analysis. • Quantify your findings where possible. • Don't: • Just use as a static tool – show trends in each of the areas. Hints and Pitfalls Data Sources • Industry reports • Analysts’ reports • Database searches • See also related analytics sources Related Analytics • PEST • SWOT • Segment attractiveness • Product life cycle • Product substitution • Competitors comparison
Porter’s five forces 1 2 3 Analyze industry structure Identify rules of the industry and derive chances and risks Develop and implement measures
Porter’s five forces Highlyunattrac-tive Un-attractive Neutral Attrac-tive Highly attractive Economies of scale little high Product differentiation poor pronounced Brand identity poor high Conversion costs low high Entry barriers Access to sales channels broad limited Capital needs low high Access to state-of-the-art technology broad limited Access to raw materials broad limited Protection by government not available strong Experience effect unimportant very important Specialised assets many few One-time exit costs high low Exit barriers Strategic linkages many few Emotional restraints many few Legal and social restrictions many few Number of comparable competitors many few Industry growth slow fast Fixed or storage costs high low Rivalry amongcompetitors Product characteristics consumables specialised prod. Capacity increases large steps continuous Diversification of competitors high low Strategic assignments many few
Porter’s five forces Highlyunattrac-tive Un-attractive Neutral Attrac-tive Highly attractive Number of important buyers few many Availability of substitution products fromother industries high low Buyers’ conversion costs low high Buyers’ threat with backward integration strong weak Buyers’ negotiation power Industry’s threat with forward integration strong low Importance for the quality or service of thebuyers high low Buyers’ total costs in the industry large share small share Buyers’ profitability low high Number of important suppliers few many Availability of substitution products for thesuppliers’ products low high Differentiation or conversion costs fordelivery products high low Delivery’s threat with forward integration strong weak Suppliers’ negotiation power Industry’s threat with backward integration strong weak Suppliers’ importance for the quality orservice of the industry high low Overall industry costs caused by suppliers large share low share Importance of the industry for the suppliergroup low high
Porter’s five forces Highlyunattrac-tive Un-attractive Neutral Attrac-tive Highly attractive Availability of closely related substitutionproducts high low Users’ conversion costs low high Availability ofsubstitutionproducts Profitability and aggressiveness of thesubstitution product manufacturers high low Value for money of substitution products high low Industry protection disadvantageous advantageous Industry regulations disadvantageous advantageous Political continuity low high Authority measures International capital transfer limited unlimited Customs high low Foreign exchange operations limited unlimited Foreign ownership limited unlimited Help for competitors substantial no
Porter’s five forces Competitive Dimensions Factors Influencing the Relevant Competitive Dimensions Short Characterization of the Industry Potential competitors • Market entry barriers for new competitors are: • Economies of scale • Product differences reflected by a corresponding buyer loyalty • High capital need for market entry • Conversion costs for the buyer when switching to another product • Extraordinarily good and expensive sales channels • Size-independent cost advantages (patents, raw materials, location, subsidies, governmental barriers) New competitors • Intensive rivalry emerges from: • Many similar competitors • Weak industry growth • High fixed costs in case of high capacity reserves • Differentiation of competitors only via the price • High strategic stakes (gains in market share at any cost) • High exit barriers Threat of substitution • Substitution threat develops due to: • Real or potential attractive substitution products • Offensive marketing for substitution products and services • Impossible defense against substitution products e.g. via common standards, using sales channels etc. • New products due to technology development
Porter’s five forces Competitive Dimensions Factors Influencing the Relevant Competitive Dimensions Short Characterization of the Industry Suppliers • Factors increasing the suppliers’ negotiation power : • Large competitive advantages of the delivered product • Low number of potential suppliers • Great importance of the product for the quality of the client’s product • High conversion costs when switching the supplier • Low significance of the client for the supplier • Credible interest in a forward integration Customers • Factors increasing the buyers’ negotiation power: • High market power at buyer side • Large number of alternative providers for the buyer (standardised exchangeable products) • Cost and market transparency for the buyers (ex. marketplaces) • Few buyers emerge in a concentrated fashion • Low conversion costs and risks for the buyer when switching the supplier • High industry products’ share of total costs at buyer side (strategic purchasing policy) • Revenue problems at buyer side, who want to pass them on to their suppliers • Credible threat with backward integration in the value chain
Customer experience – introduction What It Is Why We Use It • Understand what events affect the customer’s relationship to decide what levers the client should manage strategically and operationally to retain the customer • Highlight what processes are key to efficiently serve and retain the customer: • Both practical (eg. switchboard) and technical (eg. R&D) • Help focus creativity on areas where opportunities to create a competitive advantage appear • Illustrates key areas of customers interactions with a business: • Usually shown as a succession of interaction with a company • Should account for what the customer goes through from the time they first become aware of a product to the point they stop using it • Can be generic for an industry or specific for a given company • Provides a starting point to identify areas of potential differentiation • Answers a series of questions as to what, where, when, how and why customers buy, e.g.: • How do consumers become aware of their needs? • How do consumers order and purchase? • How is your product repaired or serviced? • Highlights what criteria are important to customers in purchase and discontinuation decisions • A variant of the value chain concept: • Plots customer interaction against it Strengths & Limitations • Strengths: • Interprets the industry/company value chain from customers’ perspective • Helps put them in their customers’ shares: • Can help make understanding very tangible for clients: • Puts them in their customers’ shoes. • Limitations: • Lengthy process • Requires wide ranging customer surveys
Customer experience – how to do it 1. Get a rough understanding of how and why consumers are buying: • Analyse consumer surveys • Talk to experts in the client company • For each key dimension of the customer experience, capture: • What takes place, where, with whom, and how • What influences the customer and why • What customers are satisfied/dissatisfied with and why • Validate your understanding with customers: • Conduct customer focus groups and customer interviews 2. Map the customer’s experience to the client’s processes 3. Identify associated activities—to deliver the customers’ experience 4. Use focus groups to analyse where areas exist for potential improvement
Customer experience – illustrative output • An Illustration of Customer Experience in the Telcos Brand awareness Product & service availability Ease of buying Ease of connection The FirstExperience Usage quality Quality of service Ease of leaving The Customer Experience Deliveringthe Customer Experience Branding & Positioning Product Development Sales Credit Checking Set-up & Activation Delivery Usage Customer Services Billing & Collection Service Termination Activities to Deliver the Customer Experience Company/Industry Value Chain Source: London Shop Training Module: “Production Market/Industry Analyses and Using Strategic Frameworks”, 27/2/98, p. 14.
Customer experience – top tips Potential Insights • Highlights typical source of customer satisfaction and retention by appreciating the context within which each step of the consumption chain unfolds • Suggests levers for differentiation • Provides a basis for exploring many non-traditional ways to create value Hints and Pitfalls • Do: • Perform the exercise for each important customer segment • Compare customers’ actual experience with your client’s perception of what that experience is • Link to functions and processes • Use personal experience a a starting point to understand the process • Don’t: • Over simplify the customer experience: • Its complexity may suggest levers for differentiation • Develop your point of view from a too limited set of specific experiences
Customer experience – data sources, case examples and related analytics Data Sources • Personal experience • Customer survey • Interviews: • Customer • Experts • Focus groups • Market research • Experience on other projects Related Analytics • Most useful when conducting a customer analysis • Can be complemented by the following analytics: • Needs based segmentation
Market-sizing and share – introduction What It Is Why We Use It • Quantifying the size and growth of a market or segments either by: • Value (of revenue or profitability over a specified period). • Volume (of units produced over a specified period). • As with many strategy analyses, it is important to show the dynamic, i.e. quantify the size of a business or segment over time: • Historically (over a number of years). • Forecasting (projecting out over future years). • In some cases, market size may be available from secondary data sources—otherwise we must estimate it. • Measure of how much of a business market or segment individual competitors account for. • Market share can be measured by: • Value (i.e. proportion of total revenue or profit). • Volume (i.e. proportion of total units produced). • Typically, we look at both absolute market share, and relative market share (i.e. share compared with other competitors’). • There are several market share measures: • Absolute and relative share of total business market. • Absolute and relative share of total business segment. • Absolute and relative share of total addressable market (i.e. segments in which our client competes). • Help determine absolute and relative share of competitors in a business or segment: • Essential to understand which competitors are successful or unsuccessful. • Helps determine the attractiveness of a business or segment: • Its size. • Whether it is growing, flat, or shrinking. • Relative attractiveness compared with other businesses or segments. • Determine the power of competitors compared with each other, customers, and suppliers. • To determine the relative performance and position of competitors, and how this is changing over time: • Who’s successful/unsuccessful? Why? • Are new entrants gaining share? • Are substitutes being used? • In conjunction with other analytics, establishes whether share builds other advantages, e.g. lower unit costs, RMS vs. ROCE. Strengths & Limitations • Strengths: • Provides a quantitative measure of business of segment attractiveness. • Provides the key benchmark against which we measure market share, and determine relative performance of competitors. • Essential to understanding competitors’ relative size, importance, and performance. • Limitations: • Sizing a market from scratch can take weeks or months. • Not the only determinant of attractiveness c.f. potential to make money.
Market sizing and share – how to apply it 1/n Current size Starting size n = number of years growth CAGR = Market Sizing Sizing Based on Publicly Available Data Constructing Own Estimate of Market Size • Understand how sources size the market (i.e. methodology). • Evaluate reliability of source data. • Try to obtain 2–3 independent estimates of market or segment size, and cross-check estimates. • Understand trends in market size and underlying root causes. • Validate total size and trends with client and/or industry experts. • Identify key drivers of market size, e.g.: • Number of customers in total business or segment. • Number of units of goods or services (e.g. number of flights, number of cars produced). • Average number of units purchased per customer. • Identify key drivers of future market size, e.g.: • Relevant macroeconomic trends. • Changes influencing customer demand. • Changes in number of customers, or average purchases per customer. • Develop methodology to size the market—there are two broad approaches: • Top-down, i.e. from macro-variables (e.g. total size of related businesses). • Bottom-up, i.e. from micro-variables (e.g. number of customers). • Often we use both a top-down and bottom-up approach to check results. • Develop picture of how things have changed over time: • What is the 5 year growth rate? • Calculate Compound Annual Growth Rate (CAGR). • Split out real and nominal growth for value basis, i.e. adjust for inflation. • The time available and degree of accuracy required will determine choice of methodology. • Once you have developed your methodology, the key stages are: • Developing and documenting assumptions. • Gathering data. • Building market size estimates. • Validating and refining market size estimates.
Market sizing and share – how to apply It Calculating Market Size Steps before Determining Market Share • Determine the business market(s) or segments to be sized • Size the business market(s) or segment(s): • See Market-sizing • Identify the company's or individual competitors’ sales, profits or units of output Various Market Share Measures Exist Measure of Share How to Do Absolute Market Share – Business Total Company Sales Total Market Sales Absolute Market Share – Segment Company Segment Sales Market Segment Sales Relative Market Share – Business1 Total Company Sales Total Sales of Largest Competitor Relative Market Share – Segment1 Company Segment Sales Biggest Competitors’ Segment Sales 1 If company is the largest, compare to other players.
Market-sizing and share – Illustrative output 5000 100% 4500 90% 4000 80% 3500 Business CAGR 70% 3000 Other 9 % 60% 2500 Medipsy 11 % 50% GSMS 301 % 2000 40% Dynamis 23 % 1500 30% Acute care 25 % 1000 20% Overall 24 % 500 10% 0 0% 1993 1994 1995 1996 1993 1994 1995 1996 Market Sizing Evolution of sales by Business Segment Evolution of % of Total Sales by Business Segment
Market-sizing and share – top tips Potential Insights • Analytic helps determine: • Industry attractiveness (past, present, future). • Relative success of competitors (when used to determine absolute and relative market share). • Competitive pressure (from growth rates and consolidation). • Degree of market concentration/fragmentation. • Relative performance of competitors, and how this is changing. • Critical issues to probe further (e.g. why competitor X is gaining share; cost advantages of holding dominant share). • Hypotheses regarding market share and profitability of competitors. Hints & Pitfalls • Do: • Sanity check first (comparisons with GDP, demographic data, other countries). • Cross-check all data (both publicly available market size data and own estimates). • Test/validate with client market size assumptions and output. • Gather past, present, and future market size estimates. • Probe for the root causes of changes in total market size. • Ensure consistency between methodology for measuring total market size and measuring individual companies’ performance. • Look at relative share (i.e. not solely absolute share). • Don’t: • Only use this data to determine attractiveness • Just use to size revenue (can size by other units, e.g. units at output). • Over analyse—insight often comes from other analysis. • Assume a client’s calculation is correct: • Always check industry assumptions. • Forget to look at historical developments.
Market-sizing and share – data sources, case examples and related analytics Data Sources • Publicly available data: • Client’s data (business plans, and internal reports) • Annual reports (for client and competitors) • Broker reports (from investment banks) • Industry reports • Database sources • Industry associations • Covered in relevant sections on related analytics: • No additional data required to determine market share. Related Analytics • Market-sizing is a critical step within Business Definition (see introduction of this section) • Company/competitor analysis • Financial analysis/ratios analysis
Markets can either be sized using data from a 3rd party provider, or by creating an approximation in-house Approaches to market sizing Create an in-house approximation using component data and proxies / assumptions where necessary Publicly available data from 3rd party Not publicly available data from 3rd party Top down Bottom up x + y + z a + b + c $ $ $ In reality it is rare to be able to pluck a market size estimate directly from a 3rd party.
Whenever data from a 3rd party is used to estimate a market size or as part of a sizing calculation, certain ‘tests’ should be applied Checklist for 3rd party data Why important • Understand how sources size the market i.e. methodology • Evaluate reliability of source data • Try to obtain 2-3 independent estimates of market or segment size, and cross-check estimates (triangulation of data) • Use opinion from industry experts – vital to confirm this with other industry experts and to validate with your client • Definition or scope of market may be different • Source must be credible with client. Are the assumptions valid? • Gives a degree of confidence and a sense check of ‘the answer’ • Industry experts hold good credibility and may provide information that is not available from a 3rd party report Just because a 3rd party has published a figure, does not mean it is correct or exactly meets your needs.
Top-down and bottom-up approaches are used for different purposes, and each approach has associated advantages / disadvantages When to use Likely type of data sources Advantages / disadvantages Top-down • When answer is required quickly • High degree of accuracy is not required – approximation only • No data available to support bottom-up • Global / national statistics e.g. adults in UK • Macro industry level data e.g. size of beverage industry • Percentage splits / data points to break down high level data e.g. % of adults in UK who drink coffee • Can be as quick and simple as required • Gives a good estimate of the rough size • Highly assumption driven and less accurate than bottom-up • Answer may produce a large range Bottom-up • When a more detailed and accurate answer is required • To validate a top-down approximation • Company specific data of organization in the segment / industry • Data for substitute products or comparable markets / industries • Data for a certain / partial time period • Customer data • Most accurate way to approximate size if no 3rd party data available • Can be time consuming, very detailed and require high level of logic and cross-referencing of data Whichever method is used, it is important to clearly present your method, assumptions and data sources.
Top-down – a worked example How many people go on the London Eye every year? Total potential visitors to London Total visits to tourist attractions Total visitors to London Eye Total visitors to London Foreign visitors to London Foreign visitors to London Foreign visitors to London 1m 1m 4m Assumption: 4 tourist attractions per person Assumption • There are 25 main tourist attractions in London, who each have an equal number of visitors UK (non London) residents UK visitors to London UK (non London) residents 50m 10m 20m Assumption: 2 tourist attractions per person Assumption: 20% visit London once a year London residents London residents London residents 10m 10m 10m Assumption: 1 tourist attrac-tion per year 61m 21m 34m
Bottom up – a worked example How many people go on the London Eye every year? Visitor capacity of London Eye per hour Summer visitors to London Eye Winter visitors to London Eye Total annual visitors to London Eye Number of pods Av. occupancy of pods per hour Av. occupancy of pods per hour 20 pods 50% of 1000 25% of 1000 x x x Rotation of each pod per hour Opening hours Opening hours 2 rotations 12 hours 6 hours x x x Capacity of each pod Opening days (26 weeks) Opening days (26 weeks) 25 people 7 days per week 5 days per week 1000 peopleper hour 1.09m summervisitors 0.20m wintervisitors 1.29mvisitors
Having sized an industry, it is important to understand historic and future growth rates Calculating growth rates for a particular market What type of information are you looking for? How can you get that information? • Historical growth rates: • Per year if possible • Over a 3-10 year period, depending on the nature of the market • Providing a CAGR (compound annual growth rate) for the period • Projected future growth rates: • Based on assumptions from industry experts with input from yourself/your client • Over a relevant time period • Including a CAGR • Use published data if available • Otherwise, you can use a similar approach to the market sizing estimates e.g. top-down or bottom-up assumption driven estimates • Use published data if available • Otherwise, use sensible estimates based on trends within the industry / market and/or historic figures and/or macro level figures e.g. growth will continue at same rate as last 10 years, or growth will continue at same rate as GDP Understanding why the market is growing or contracting is just as important as determining what the growth is.
There are two methods to calculate growth – compound annual growth rate and average annual growth rate 1/n-1 Last year [ ( ( ) ) - 1 ] x 100 First year 1/5-1 200 [ ( ( ) ) - 1 ] x 100 100 = 18.9% 200 – 100 ( ) / 5 x 100 100 = 20.0% CAGR formula CAGR formula CAGR Average annual growth formula Average Annual Growth Rate Last year – first year ( ) / n x 100 First year CAGR is a more sophisticated calculation and is used more widely than average annual growth rate.
Company/competitor analysis – introduction What It Is Why We Use It • An assessment of a company’s own (or competitors) performance that should, at the least, include: • Background information: • Date founded • Overview of what the company does • Executive team • Vision statement • Ownership structure • Organisation structure: • Size of subsidiaries’ workforce • Key financials: • Current, historical, and projected, (see financial analysis) • Market positioning: • Market share, geographical markets, target customer segments • Channel usage: • Percentage through each, productivity • Product portfolio: • Main products • Price brackets • Relationship to industry value chain: • Key suppliers and customers • Distribution channels • Recent actions/moves – ”late breaking news” • Strategic issues and behaviour` • Provides a basic understanding of a company and its performance • Directs further analysis by highlighting key strengths and capabilities • Use of a common template can enable a comparison between players • Identify number, names and focus of players • Understand strategic positions (product/service offering, channel usage) • Identify strengths and weaknesses of different players in an industry • Identify gaps in portfolios and capabilities of client • Identify relative strength of client company • Understand key competitor moves Strengths & Limitations • Strengths: • Gives a clear overview of basic facts about a company: • Necessary to add insight to competitor or market analysis • Provides direction to further analysis • Efficient way to capture vital data on competitors • Gives overview of competitors’ attributes along multiple axes • Limitations: • May provide few insights in itself: • Requires benchmarking over time or against competitors • Often complex and difficult to use effectively in presentations: • Need to extract key messages and display using other tools • Requires effort to summarise • Often focuses on the present rather than the future: • Difficult to determine competitors’ strategic shifts
Company/competitor analysis – how to do it Acquire a Basic Understanding of the Company/Industry Determine data needed Gather and analyse data Evaluate Company • Read general information about the company on its Internet site • Read introduction to analysts’ company reports • Establish where it fits in the value chain • Ensure all necessary background information is included • Include information related to the strategic issue being examined by the project • There are a wide variety of sources available • Analyse data where appropriate: • Use financial analysis techniques • Product/channel analysis • Understand key trade-offs that competitors in an industry have: • e.g. niche vs scale • Plot competitor field maps • Understand relative competitive positions and rationale: • Product/Service offerings • Channel usage • Depending on what we need to know, use SWOT model to help evaluate competitor • Ensure analysis relates to, or answers the questions, we are trying to answer