Download
1 / 33
330 likes | 696 Views
Child growth charts in Australia. Murdoch Childrens Research Institute Funded by Australian Government Department of Health and Ageing. 2013. Why monitor children’s growth?. Child growth = important marker of health and development best measure of nutrition

E N D
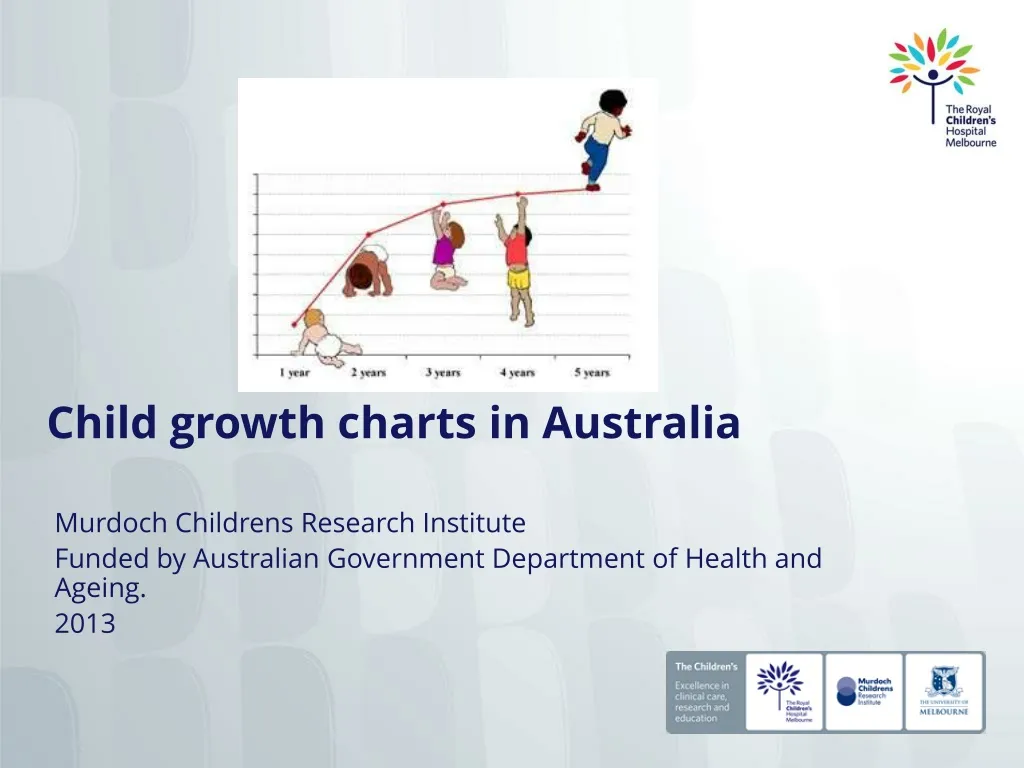
Child growth charts in Australia Murdoch Childrens Research Institute Funded by Australian Government Department of Health and Ageing. 2013
Why monitor children’s growth? • Child growth = • important marker of health and development • best measure of nutrition • abnormal growth may show underlying health or developmental problems • quick, non-invasive techniques
Healthy growth Weight and length ‘tracking’ on percentiles Growth is influenced by: Genetics and epigenetics Environment Nutrition Biological (e.g. birthweight) Health and wellbeing
Percentiles explained • 97th percentile • 3 in approximately 100 children are above this line • 3rd percentile • 3 in approximately 100 children are below this line • 50th percentile • Half the children at any age are above this line and half are below
Current uses of growth reference data and charts • Individual children • Surveillance tool to monitor individual child growth • Early identification of poor growth or obesity risk • Populations • Analysis and reporting of population growth data and trends
Growth charts show the growth of a reference population and are used to assess growth of individuals and groups • Serial measurements are plotted on a growth chart to assess patterns of growth • Single or ‘one off’ measurements are less meaningful
National Centre for Health Statistics (NCHS) (1977) • used cross-sectional data from US health surveys from 1960’s – 1970’s • data for children birth – 3 year olds was from a longitudinal study in Ohio concerns • mostly formula fed infants • measurements collected between 1929 – 1974 from a small geographical area • infrequent measurements
Centers for Disease Control (CDC) (2000) based on US national health surveys between the 1960’s and 1990’s excluded very low birth weight infants (<1500g), and data from the newest survey for children over 6 due to increasing overweight in the population statistical methods were used to obtain smooth percentile lines from cross-sectional measurements at the time, charts thought to be racially and ethnically diverse and representative of the US population concerns: mostly formula-fed infants – only half had ever breastfed, and only 21% were exclusively breastfed 4 months small sample size in the birth – 6 months age groups (< 100 per age group) skew towards higher weights in the older age groups probably because of increasing rates of obesity in the population
World Health Organization (WHO) 0 – 5 years (2006) Multi-center growth reference study (World Health Organization) –measured children from 6 countries representing different regions of the world: Brazil, Ghana, India, Norway, Oman and the United States. Purpose of the study was to more closely represent the growth of breastfed infants, especially in the first 12 months Inclusion criteria: • no health, environmental or economic constraints on growth • single-birth, term baby • no significant morbidity • willing to follow health and feeding recommendations: • non-smoking mother • exclusive or predominant breastfeeding for at least 4 months • introduction of solid foods between 4 and 6 months • continued breastfeeding until at least 12 months • Routine paediatric health care visits and immunisations
Brazil Ghana India Norway Oman 80 USA 70 Mean of Length (cm) 60 50 0 200 400 600 Age (days) Study showed there is no effect of ethnicity on infant growth Linear growth of children from 0 – 2 years from the 6 sites
WHO charts 5 – 19 year olds (2007) • Growth charts for children over 5 years were released in mid 2007 • Based on historical data from the NCHS/ WHO 1997 growth reference • A longitudinal study was not feasible • Data was merged with the under 5’s growth data to make smooth curves • Outliers for both height and weight for age and BMI for age were removed to avoid the influence of unhealthy weights • BMI charts were created for 5 – 19 year olds • At age 19 years the +1 SD is equivalent to the overweight cut off for adults (25 kg/m2) and +2 SD is equivalent to the adult cut off for obesity (30 kg/m2)
Differences between the WHO and CDC charts 0 – 2 years Growth data • CDC: how sample population grew • WHO: healthy children raised according to best practice health practices Consistency with current nutrition recommendations • CDC: 50% any breastfeeding, 21% at 4 months • WHO: all breastfed, 75% at 4 months
Differences between the WHO and CDC charts 0 – 2 years Longitudinal vs cross-sectional measurements • CDC children measured once • WHO each infant measured 21 times between birth and 2 years Obesity issue • CDC removed weight data for children over 6 years, but not under 6 years • WHO excluded very overweight children 0 – 2 years and 2 – 5 years International representation • CDC: single country • WHO: 6 countries
Australian recommendations WHO charts birth – 2 years For breastfed and formula fed- infants CDC charts 2 – 18 years Consistent with recommendations from: National Health and Medical Research Council (NHMRC): Dietary Guidelines (2013) Infant feeding guidelines (2012)
Recommended charts for Australia • 1 NT uses WHO charts 0 – 19 years
How to assess children’s growth • Ensure serial measurements of both weight and length / height are collected over time • Plot weight and length / height on age and gender-appropriate growth chart • Healthy growth = weight and length / height track along a curve (even if ‘off’ the chart) • Poor growth = decline in rate of weight gain first, followed by length / height gain • Excessive growth = increase in rate of weight gain; increasing weight percentiles
And... • Correct for prematurity until approximately 2 years of age • Specific charts are available for some conditions/syndromes (but these are not validated and should be used along with standard WHO and CDC charts)
‘Flags’ • Weight or length / height (stature) < 3rd percentile • Weight or length / height (stature) > 97thcentile • BMI > 85th percentile • Further investigate • Unexplained weight loss • Weight not regained following acute illness • Weight or length stature ‘plateau’ • Weight, length / stature or BMIincreasing or decreasing centiles
Poor growth The best indicator of poor growth is weight and / or length tracking downwards on percentiles on the weight and /or length for age growth charts Other less reliable definitions include: • weight dropping percentile lines on weight for age growth chart, • weight and length are more than 2 percentile lines apart on the weight and length for age growth charts, • weight or length for age below the 3rd percentile.
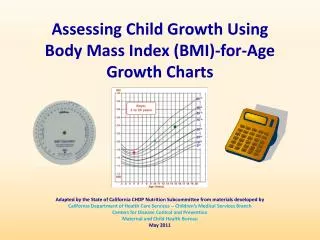
Overweight • BMI (body mass index) is the standard tool to assess child overweight over 2 year olds • BMI = weight (kg) height (m2) • Unlike adults, BMI for children depends on age and stage of growth • Overweight = > 85th percentile for age on BMI chart • Obese = > 95th percentile for age on BMI chart
Child growth discussions • Use a sensitive approach • Most children do grow well • Reinforce positive aspects of child’s growth and development • Explain growth chart and percentile lines • Show the child’s weight on the weight for age growth chart • Show the child’s length / height on the length /height for age growth chart • Explain the trend in child’s weight and length /height compared with previous measurements • If there is a change in the trend of child’s growth, ask the parent / carer if they think anything may have contributed to the change. Try to use open-ended questions to prompt discussion.
Key points chart changes do not change individual children’s growth stick to one chart do not rely on one measurement the trend is more important than single measurements need calibrated, accurate equipment need accurate measuring and plotting despite many parents’ perceptions the 50th percentile is not the goal for each child
Birth to 2 years Weight to nearest 10g To nearest 0.1cm purpose‘infantometer’ to nearest 0.1cm
Over 2 years Portable or fixed ‘for purpose’ To 100g / 0.1cm
Key references • Australian • Child growth website • Eat for Health • Australian Dietary Guidelines (2013) • Australian Infant Feeding Guidelines (2012) • International • WHO growth charts • CDC growth charts • UK growth charts • Canada growth charts