Download
1 / 40
400 likes | 518 Views
Genes and Isochores: A Game of Chicken?. William H. Press UT Austin Harlan Robins Fred Hutchinson Cancer Research Center. What are “Isochores”?. our convention is to plot AT up. Megabase regions in the genome of dominant A+T or G+C

E N D
Genes and Isochores: A Game of Chicken? William H. Press UT AustinHarlan Robins Fred Hutchinson Cancer Research Center
What are “Isochores”? our convention is to plot AT up • Megabase regions in the genome of dominant A+T or G+C • Discovered chemically, before sequencing! (Bernardi 1980s) • In all mammals, birds, some crocodiles, turtles (~300 Ma) • (Other organisms are in effect 100% AT isochore.) • Probably not still forming: decreasing in mammals last ~200 Ma (Belle et al.) • No obvious correlations between gene function and isochores. Fish: no isochores
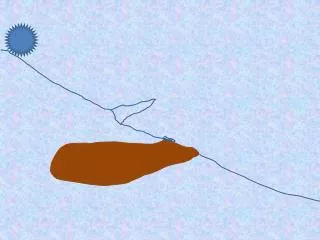
chromosome ends almost always CG isochores much larger than telomeres exceptions chr 9, 21 whole chromosomes can be CG (16, 17, 19) interior CG isochores seemingly random Human isochore map has evident regularities. But are they significant or only anectodal? Pioneer 10: first representation of humans to leave the solar system
Genes also divide into two populationsby AT vs. CG richness • Clearest separation for 3’UTRs • by A+T vs. C-G • But also find “cigar-like” distributions for: • 3rd codon usage • 5’ UTR • intron • upsteam and downstream regions • As if a gene “likes” to be either AT or CG • Effect seen only in species with isochores Robins & Press (2005)
Vertices are 100% a single base Edges linear combination of two bases, etc., etc. Shown here are the 3’ UTRs for 3000 random human genes. Nucleotide fraction maps to the interior of a tetrahedron (since A+C+G+T=1)
To good approximation there are 3 , not 4, populations of genes in isochores: iAT/AT, iCG/AT, and iCG/CG In other words: few, if any, CG-rich genes in AT isochores!
AT rich genes are preferentially “early” processes: transcription, translation, mRNA CG rich genes are preferentially “late” processes: signaling cascade, receptor, membrane We found significant functional differences between AT and CG genes in GO word counts Robins & Press (2005)
We do not find significant functional differences between iAT and iCG isochores, but we did between AT and CG genes! How can this be? iCG isochores contain a mixture of CG and AT genes, so the GO signal averages out. iAT isochores contain predominantly AT genes, but we find no functional signal in AT isochores Hypothesis: In CG isochores, some genes resisted isochore formation for functional reasons. Hence strong GO signal. In AT isochores, the genes were “never challenged”, and we see a “pre-isochore” mixture of the two functional populations.
We can look for correlation between gene AT richness and that of the flanking intergenic region genes “lead the charge” genes “resist”
Results for human genes CG genes strongly leading (not lagging) in CG isochores AT genes (in both AT and CG isochores) weakly leading (slope), but barely differ from surround Offset from zero due to AT leading, or to slight functional AT richness bias?
AA’s are over-represented in CG rich genes (measured by synonymous 3rd codon) iff their genetic code has C and/or G rather than A and/or T Essentially 100% correlation if you break ties by A > G > C > T CG rich AT rich 3rd codon decile Amino Acid frequencies show that CG pressure in the genome affected the proteome, too
The effect on the proteome is even clearer if we look at fish orthologs to human-iCG/CG genes • Indicates 1st and 2nd position codon changes (we already know 3rd codons changed) • Expect to see small number of near-neutral substitutions • Instead, see large numbers of substitutions that make little biochemical sense • E.g., Pro +20%, Ala +19%, Asn -21%, Ile -18% underlying diagram after Betts and Russell (2003)
But they make sense if the pressure is to increase CG in the genome despite any fitness cost in the proteome 27 changes turn A,T to C,G 5 (italics) are neutral zero turn C,G to A,T
color: humanheight: chicken each dot is a gene height is AT fraction color is isochore type
color: humanheight: human each dot is a gene height is AT fraction color is isochore type
color: humanheight: human color: humanheight: chicken What you should have seen in the blinking of the two previous slides • Almost all short chicken chr’s are iCG in both human and chicken • sometimes AT/iCG are same genes (chr 13) but more often independent • Almost all human iCG in long chicken chr’s are chicken iAT (chr 1,2,3) • When chicken chr ends are human iAT, they are often chicken iCG(chr 2R, 4L, 8R, 9R)
many interior isochores “explained” many end isochores not “explained” whole chromosomes 16, 17 “explained”, 19 ambiguous Compare human isochore map to painting some chicken chromosomes onto human genome paint blue chr 5, 10-32paint red all other chr paint blue AT isochorespaint red CG isochores
Human iCG that are chicken iAT are at human, but not chicken, chromosome ends human chr ends shown green color: humanheight: chicken
So, of all orthologous genes, 40% were “marked” in the common ancestor to become CG rich in both species Of the remaining 60%, 15% independently became CG rich in human, 15% independently in chicken (agreement of values coincidental) Hypothesis is that this reflects new chromosome ends exposed after divergence “Marked” (e.g., by ends) not necessarily same as “realized” (e.g., by mutations) Can also ask whether same or different genes became CG in chicken and human use 4-component Gaussian mixture modelto find the proportions: plug into a model for correlated and independent fractions: solving for the model parameters gives:
Simplest hypothesis, marking and realizing in same epoch, has problems with phylogeny isochores? yes 40% of genes marked and realized here? yes yes yes NO! Also (preliminary), we can rule this out by a Markov model on aligned 3rd codons by proving independent realization, even of ortholog genes. “marking” = chromosome ends“realizing” = start biased mutation
Possibly, the onset of biased mutation occurred coincidentally on two branches, but this seems unlikely! isochores? yes biased mutatation starts independentlyhere and here 40% marked here yes yes yes NO! “marking” = chromosome ends“realizing” = start biased mutation
Most plausible may be an independent event blocking squamates (or do they have unobvious isochores?) isochores? yes mark here, and turn on biased mutation at chromosome ends biased mutation continues here yes yes yes X NO! but is stopped here “marking” = chromosome ends“realizing” = start biased mutation Will be easy to sort this out when we have full genomes of these
Where does this project need to go? • The basic hypothesis is that exposure to chromosome ends “causes” most (but not all) genes to become CG rich • maybe (1st approximation) in proportion to the exposure time? • can weakly predict, by function, the genes that don’t • It’s easy to tell whether an ortholog gene became CG rich in a common ancestor vs. independently on two branches • so, we get time information on when the exposure occurred • More relevant genomes are now available • though mapping to chromosomes (from scaffolds) is about the last thing done • So, how can we use phylogenetic methods to estimate a gene’s end exposure and test the hypothesis? • how best to do “phylogeny of chromosome ends” • And, of course, what is the biological significance of isochores? • defense against chromosome breakage? why all of a sudden? • or did something change in biased gene conversion (BGC)? • defense against LINEs or another class of transposons?
Summary (I): What do we know? • AT-richness is the ancestral state • fish, frog, etc. • CG isochores formed at chromosome ends • human, chicken, and ancestors • short chromosomes count as “all ends” • Within CG isochores all base positions see evolutionary pressure to become CG-rich • introns, exons, and intergenic regions • some genes resist and remain AT-rich • can be understood functionally as “older” or more conserved processes involving DNA, RNA processing • associated with miRNA targets • but most “led the charge”, more extreme than surroundings • especially functionally associated with signaling, membrane processes • but “lagged the retreat” still possible as isochores “unform”
Summary (II): What can we guess? • A process “turned on” in the amniote CA that strongly favored AT CG at chromosome ends • the “minimal hypothesis” • many amino acid changes • but was it a positive selection or just a strong mutation bias? • Most of its active time was after the mammal/ reptile split • preliminary: we have aligned orthologs to verify this • It probably “turned off” (independently) • early in the squamate ancestor • unless they have occult isochores in some way • more recently in mammals • while nearly all iCGs are going away (comparing human, chimp, monkey), a few iCG human chr ends have the opposite trend
Summary (III): What we don’t know • What was the process, exactly? • biased gene conversion? • mutational hot spots with bias? • positive selection for “stronger” chromosome ends? • Why did it turn on? • Why did it turn off? • Or did it? • Could it be episodic, with occasional large “advances” balanced (or not balanced) by slow “retreats” • Human chromosomes 3, 4, 6, 8, 15, and 20 may have iCGs continuing to form at one or both chromosome ends
How to look for something seemingly as vague as “challenged” and “resisted”? hmm. a lot of blue dots (CG genes) seem to be at extrema iCG maybe also red dots (AT genes) , but not as much? iAT can we measure this objectively?
Since we are comparing variances, we must be careful to use identical window functions • Use intron as surrogate for “count where gene is” • might expect small offset due to functional sequences in intron • We require a gap > 2 x size of gene and center the intergene window in the gap • Background has fluctuations on all different scales • Different windows differ on “regression to the mean” • Safest to use congruent windows and pairwise comparison
Search for functional differences: the Gene Ontology database can be mined by word count statistics • Why not just use the categories? Too many, too sparse, too inhomogeneous! • But functional words occur in (and thus link) multiple category definitions • Also, word counts give useable measurements of statistical error prob. gene i in + group 1 if word j describes gene i, else 0 stat. sig. with which word j describes a difference between the + and - groups the software is available atwww.nr.com/bio/gowordcount
AT isochore (iAT) “emits” 90% AT (genes) CG isochore (iCG) emits AT and CG 50/50 switch state “by chance” only every 1000 emissions (easily over-ridden by posterior) can apply to either genes or window counts results are insensitive to the parameters chosen much better than smoothing or filtering methods Can locate (objective, computable) isochores by a simple Markov model
We find the same isochores by the gene mixture model as by genomic window counts 3’ UTR • Markov model as described • Genes: 50-50 mixture in CG isochore, 90-10 mixture in AT isochore • Window counts: 80-20 or 20-80 mixture of being above/below median • Small transition probability encourages finding large isochores; results very insensitive to this value. • Get 92% agreement between isochores based on gene 3’UTRs and based on window counts. window 3rd codon
each dot is a gene height is AT fraction color is isochore type Beware!
Almost all microRNA targets are genes with AT-rich 3’UTRs • because evolutionarily old regulatory process? or because richer conformation space of AT-rich mRNA? • subject of another talk
But GO wordcounts demonstrate that miRNA targets are regulators of both AT and CG characteristic processes
The plotted ellipses are separable componentsfound by an unsupervised Gaussian mixture model two in human(AT-rich, CG-rich) (model can assign a probability to each gene of being in one component vs. the other) but only one (AT-rich) in worm and fly
Isochore formation was quite a train wreck!There are at least 7 things to explain. • (Role of genes) What made genes “lead the charge” (i.e., be at special locations)? • (Strength) Why was selection pressure be so strong as to re-engineer vast numbers of proteins? • (Scale) What made it correlate over 10s of Mbases? • (Gene-gene correlation) Why is it larger than intergene-intergene on large scales? • (Asymmetry) Why do iCG’s contain AT genes, but not vice versa? • (Relation to function) What made iCGs stratify according to GO function? • (Spatial broken symmetry) How did any specific region decide to become an iCG?
Fish, with no isochores, shows pattern similar to human, but much more moderate Genes tend to be more extreme than surround, both for AT rich(er) and CG rich(er) Offset of otherwise symmetrical distribution supports its being due to small amount of functional AT rich sequence in introns Fish genome looks a lot like human AT isochores.
But fish genes have little or no long-distance correlation in AT, while human genes do • Shown is structure function (increase in variance with distance) • Human gene-gene is stronger than human gene-intergene or intergene-intergene • Again see that genes are special, not just passively carried along