Download
1 / 31
310 likes | 374 Views
Frame 11 @ 7:30 MST. Hypothetical “Dirty Bomb” in Salt Lake City. Frame 12 @ 7:45 MST. Hypothetical “Dirty Bomb” in Salt Lake City. Frame 13 @ 8:00 MST. Hypothetical “Dirty Bomb” in Salt Lake City. Frame 13 @ 8:15 MST. Hypothetical “Dirty Bomb” in Salt Lake City. Frame 14 @ 8:30 MST.

E N D
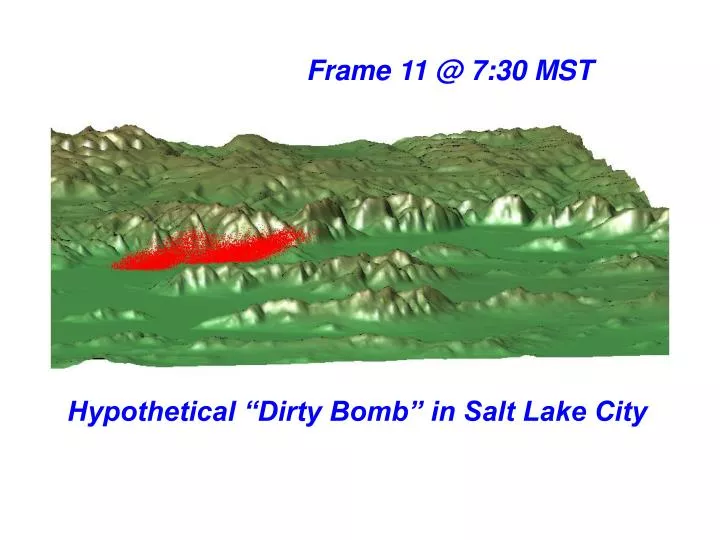
Frame 11 @ 7:30 MST Hypothetical “Dirty Bomb” in Salt Lake City
Frame 12 @ 7:45 MST Hypothetical “Dirty Bomb” in Salt Lake City
Frame 13 @ 8:00 MST Hypothetical “Dirty Bomb” in Salt Lake City
Frame 13 @ 8:15 MST Hypothetical “Dirty Bomb” in Salt Lake City
Frame 14 @ 8:30 MST Hypothetical “Dirty Bomb” in Salt Lake City
Frame 15 @ 8:45 MST Hypothetical “Dirty Bomb” in Salt Lake City
Frame 16 @ 9:00 MST Hypothetical “Dirty Bomb” in Salt Lake City
Frame 17 @ 9:15 MST Hypothetical “Dirty Bomb” in Salt Lake City
Frame 18 @ 9:30 MST Hypothetical “Dirty Bomb” in Salt Lake City
Frame 19 @ 9:45 MST Hypothetical “Dirty Bomb” in Salt Lake City
Frame 20 @ 10:00 MST Hypothetical “Dirty Bomb” in Salt Lake City
Frame 21 @ 10:15 MST Hypothetical “Dirty Bomb” in Salt Lake City
Frame 22 @ 10:30 MST Hypothetical “Dirty Bomb” in Salt Lake City
Frame 23 @ 10:45 MST Hypothetical “Dirty Bomb” in Salt Lake City
Frame 24 @ 11:00 MST Hypothetical “Dirty Bomb” in Salt Lake City
Case Study: Hypothetical RDD Ground Level Time-integrated Dose Northward transport due to surface winds Detonation Point Fumigation (downward mixing of upper level cloud) after sunrise
IMAAC Predictions Provide Responders with Key Information for Emergency Decisions • Plume hazard areas • Health effects • Protective action guidance (e.g. sheltering, evacuation) • Affected population counts • Geographical information (maps, aerial photographs, facilities of interest) • Wind observations, forecasts, and wind fields
NARAC-IMAAC Phased Response Concept of Operations 3. Refined 3-D Model Plots― IMAAC Staff Quality-Assured 4.Refined 3-D model prediction calibrated with field measurements 2. Initial 3-D Model Plots ―Fully Automated Additional Refined Plot iterations will be made for new measurements sets 1. Initial Local Model Run quickly 1-2 minutes 10–15 minutes 30-60 minutes Less than 2 hours
Plume Model Predictions Model predictions guide measurement surveys Measurements refine model predictions Measurement Surveys NARAC/FRMAC examples from TOPOFF2 Exercise Key Aspect of IMAAC/NARAC Operations is the Use Models and Monitoring in a Coupled, Cyclical Process
IMAAC Overview NARAC-IMAAC Web Portal
IMAAC Web: Select pre-defined or user-defined chemical, biological, radiological or nuclear airborne release scenario
Click on source location on the map IMAAC Web: Enter Airborne Source Information
IMAAC Web: • Display plume model results • Plume hazard areas • Predicted health effects • Affected population counts • Geographical information (maps, aerial photographs, facilities of interest) Plume models run automatically for any location in country using NARAC 3-D atmospheric flow, transport and deposition models
IMAAC Web: Display wind observations & forecasts Plume models automatically access real-time databases of weather observations & forecasts
IMAAC Web: Air or ground sampler data display IMAAC analysts can use sampler data to refine plume model predictions and reconstruct events
IMAAC Web: Display aerial and satellite images
Select individual users and/or groups of users to share plume model results with others IMAAC Web: Easily share plume model results with other authorized users
IMAAC Overview NARAC-IMAAC Modeling Research and Development
LLNL’s State-of-the-Science System Builds Upon a Tight Coupling of R&D and Operations Operational needs drive R&D objectives Operations R&D Multi-institutional collaborations Subject matter expertise R&D results quickly benefit Operations
Actual release rate Sensors Actual source Calculated source region Wind Joint Urban 2003 Oklahoma City Close-up view in source area: Contours – model predictions Small squares – field study data We Have Successfully Tested Event Reconstruction Using the Oklahoma City Data Location Predicted vs. observed concentration Strength
Uniform grid (non-adaptive) 33.6 M gridcells Improved Gridding, And Embedded Boundary Methods Improve High Resolution CFD Performance UrbanDispersion Program New York City Lower Manhattan – Madison Sq. Garden/Empire State building Resolution: 5m horizontal, 2m vertical