Download
1 / 43
430 likes | 435 Views
This presentation discusses the challenges faced by G20 economies in 2014, including the uncertain outlook, downside risks, and policy implications. It covers topics such as the US recovery, Europe's bottoming out, China's reform path, Japanese Abenomics, and the impact of AD's normalization on emerging markets.

E N D
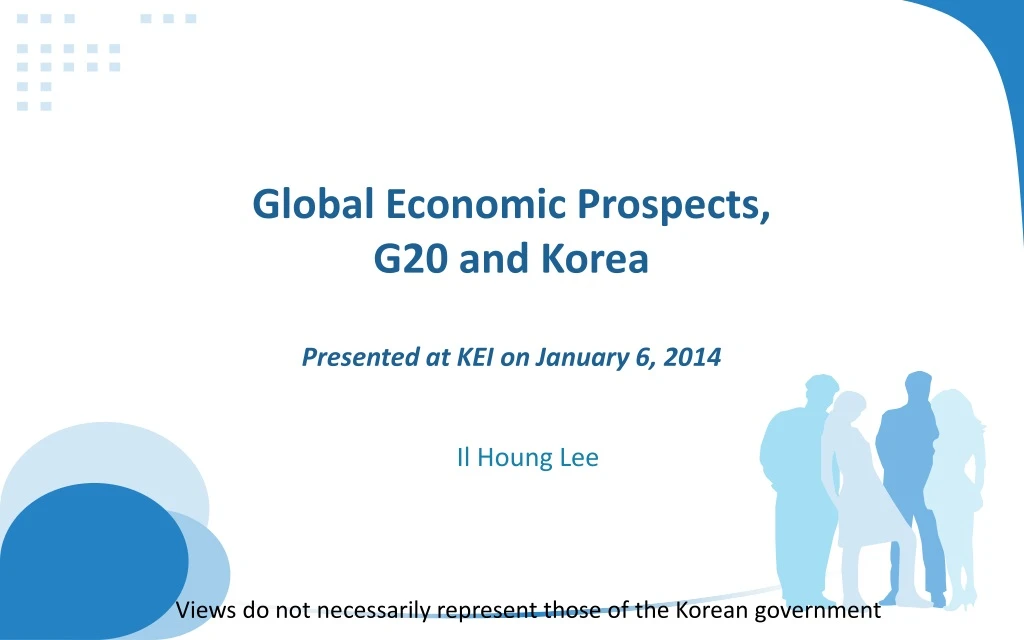
Global Economic Prospects,G20 and KoreaPresented at KEI on January 6, 2014 Il Houng Lee Views do not necessarily represent those of the Korean government
A slight positive outlook in 2014(lower potential growthvs. output gap) Advance Economies Emerging Economies
But there are downside risks related to uncertainties arising from sailing though unchartered waters
Total Spending and Revenues Components of Total Spending
Monetary policy normalization vs higher cost of funds Source: CSO
Narrowing scope for current account deficit and tighter USD liquidity Sources: IMF WEO and author’s own calculation
2. Europe bottomed out? European banks’ credit conditions has eased but still tight http://www.ecb.europa.eu/stats/pdf/blssurvey_201310.pdf?a65131225d29fa9d692ae76423b23cb9
Supply side remains sluggish reflecting weak investment http://www.ecb.europa.eu/stats/pdf/blssurvey_201310.pdf?a65131225d29fa9d692ae76423b23cb9
Banking union and Fiscal compact not yet fully there North Europe(%, lhs) South Europe(%, lhs) Eurozone(bil.euro, rhs) Note 1) GDP growth of North/South Europe minus GDP growth of Eurozone 2) Period: 2005 Q1 – 2012 Q4, four-quarter moving average Source: Oxford Economics. Note: Long-term average is 100 and t=0 refers to the peak level. Source: IMF, Euro Area Policies 2013, July, p.37
3. China’s path: Reform and long term gain vs. short term growth China: Investment-to-GDP (Actual and predicted) Total Social Financing and Property Price (In percent, year-on-year growth) Note: The average of top 10 cities’ property selling price index(at the end of year) reported by soufun is used as a proxy of property price Source: Author’s own calculation, IMF WP
4. Japanese Abenomics: Net foreign purchase Y12.9 trillion vs net domestic sale Y12.5 trillion Transactions by Residency In Yen bn Net Transactions In Yen bn
An external trigger could reverse the gains very quickly Stock price index – historical (TOPIX Composite) 2013/05/22 1,613.23 2012/06/04 879.49 Source: : Tokyo Stock Exchange; http://quote.tse.or.jp/tse_n/quote.cgi?F=histidx
5. AD’s normalization of policy stance: Impact on EMs ADs Debt and leverage overhang EMs 1 Structural problems EMs 2C Dutch disease EMs 2B Classical BOP pressures EMs 2A Reverting back to low potential growth
A more fundamental issue? 2
Is the pace of recovery “normal”?If not, cyclical (1) or structural (2)? Real GDP Growth (In log) Total Employment – Establishment Survey Percentage change from previous peak, Seasonally Adjusted, Nonfarm Business Source: World Economic Outlook, IMF Months from previous peak
1. If cyclical, can rebalancing help create durable demand? Current Account Balance, In Percent of World GDP Savings, In Percent of World GDP AD7 EMs Dev. Asia Euro
Consumption in EMs rose faster although its contribution to global consumption was somewhat smaller reflecting smaller base Consumption, In Percent of World GDP Consumption in USD, Percent Change
The world seems in need of investment reallocation Investment, in Percent of GDP Investment, in Percent of World GDP AD7 EMs Dev. Asia Euro
2. If the problem is structural in nature, fiscal stimulus may not have much traction at a time of scarce public resources Budgetary Impact of Interest Rate Increases (Percent of GDP) Good state: if r-g ↓ Fiscal expansion Bad state: if r-g ↑ Source: IMF Fiscal Monitor, April 2011
Fiscal policy can contribute significantly to redistribution of income but may not help create durable demand
2a. Debt overhang: Macro policies have been buying time, but once normalization begins, the real burden will have to be born by the economy US Total Debt % GDP vs. Household Debt Payment Total Debt = Govt. + Non Financial Business + Household Debt From Nicolas Ferres Presentation; Eastspring Investments (Singapore) Limited, October 2013
2b. Regulatory environment: In fact, household, government spending and low interest rates have supported corporate profit
Youth unemployment has been high for a decade now:Structural unemployment was hidden behind“…exuberant demand of the past decade” (G20 WG) Inactivity rates of the young population aged 15 to 24 years, 2000-10 Unweighted averages Chile, Czech Rep, Hungary, Poland, Slovak Rep, Turkey, Slovenia, Korea Source: OECD Database Source: Key Indicators of the Labour Market; October 2011, ILO
2c. Wage shares have been declining and income inequality widening for more than 2-3 decades – indicating the challenge to be a long standing issue Income inequality: Gini Coefficient in Selected Countries Wage Shares in Selected Countries 27 Source: Vinicius Carvalho Pinheiro; G20 Global Leaders Program, KDI, Seoul, 11 April 2013
Empirical evidence indicate income inequality impede growth • Investigates the nonlinear relationshipbetween inequality and economic growth a heterogeneous panel data set of 77 countries (1980-2007 yr) • The results suggest that while inequality hinders economic growth in most of the countries, it fosters economic growth only in a country where the level of inequality is very low. Inequality and growth: Nonlinear evidence from heterogeneous panel data* Estimated transition function over the transition variable Estimated time-varying coefficients for inequality from PSTR model * Excluding CIS countries * Cho, D.Y., Kim, B.M., Rhee, D.E. (2013) - preliminary
2d. SMEslackaccesstofinancingandmaybefacingadversebusiness environment despite their potential employment impact • After starting up their operation with innovative ideas, SMEs face new investment need to expand/innovate further but find it hard to obtain financing from banks. • The “financing gap” are attributed to several factors – market failures due to asymmetric information (e.g. lack of information on banker’s or SME’s side) or imperfect competition and regulatory obstacles – providing the rationale for government intervention or reforms in SME finance markets. SME Financing Gap (quotes from OECD and BIS studies) Number of persons employed by enterprise size class 2010 or latest available year SME loan share of total outstanding business loans, 2007-2011 As a percentage of total business loans
“Antitrust law has a strongly positive effect on economic growth” 1/ … might be due to antitrust laws designed to promote economic efficiency rather than to prevent economic concentration. 1/ Antitrust Law and the Promotion of Democracy and Economic Growth, Niels Petersen, Max Planck Institute for Research on Collective Goods Financial Market regulation? Product Market Monopolistic competition Partial entry barrier Trade? Large Corporate SME Monopsony Factor Market Suppliers Household and source of labor Business and investment environment and financial market regulations
The economy is slowing and converging to the global average Korea: GDP growth In percent Source : IMF
Its dependence on exports is growing, but the latter is waning Exports Growth percent change (단위: %) Percent change EXPORT IMPORT * The figure in 2013 is a share of trade to GDP till 3 quarter Source : BOK ECOS Source : BOK ECOS
REER has been gradually appreciating since the crisis, but is not having an impact on trade
Drop in domestic investment has led to a sharp increase in the recent growing CA balance S/I/GNDI (RHS)
Weaker yen is having an effect on exports, but import from Japan is falling as well
Supply chain indicates growing diversification of cross border vertical integration The ratio of production added value of major countries to exports of Korea Source: SERI
Corporate profit is slowing but still decent • Corporate profit averaged 6% during the first half of 2000s, and then fell slightly to low 5% range (4.8% in 2012); • Profit between large and SMEs remain wide; and profit concentration at largest 10 continued • Large corporate became much more capital intensive • Productivity relatively higher in L; • WL remains depressed thus WSME has to fall as MPL in SMEs are lower
Despite the recent improvement, income inequality has deteriorated relative to the early 1990s • Income inequality has worsened somewhat since the early • Highest/lowest 20% rose • Started to moderate only in the last three years; • Easier access to financing in earlier period
Expose the economy to external competition through further trade liberalization Enhance competition through FTAs FTA Economic growth Mega FTA To benefit from Supply chain
Orient policy efforts to raising employment 1/ Creating an environment fostering participation and facilitating job creation - restoring virtuous cycle Share of Poverty Rate Disciplined market Labor market policies Social safety net 20 15 10 5 40 80 90 50 60 70 Employment rate (%) 1/ Lee Jae Heung , Ministry of Employment and Labor
Change the DNA of the economy R&D Innovation Innovation TFP Convert existing and new innovations into value added • Promote innovation through R&D • Nurture IT-based industries Idea Product • Package ideas into product • Create market for trading ideas