Download
1 / 33
330 likes | 485 Views
REU/RET Optics Research Workshop 2014 Workshop #1 Excel Spreadsheets and Data Analysis. Dr. Mike Nofziger Professor College of Optical Sciences University of Arizona.

E N D
REU/RETOptics Research Workshop 2014Workshop #1Excel Spreadsheetsand Data Analysis Dr. Mike Nofziger Professor College of Optical Sciences University of Arizona Dr. Mike Nofziger 2014
Optics Research Workshop (ORW) Curriculum“These Optics Research Workshops are designed to teach participants basic opto-electronic laboratory techniques, through hands-on measurements and experiments with lasers, fiber optics, solar cells, spectroscopy, lighting, imaging, data analysis, electronics, etc. Topics and hardware have been chosen to provide a background to common lab practices that participants will (likely) see and use during their summer research experiences!Emphasis will be placed on the practical vs. theoretical aspects of lab practices and techniques. Whenever possible, we will stress applications of hardware to real-world laboratory situations.”In the process, participants will gain hands-on experience with some of the basic and most useful lab techniques most important in an optics lab.RET participants (especially) will learn ideas about teaching optics in their classrooms.All of us will explore ways to integrate optical sciences with Native American cultures. Dr. Mike Nofziger 2014 Workshop 1-1
Workshop #1 Outline:● What is Optics and Optical Engineering? “Optics Is…”● What is Light?● Basics of Excel Spreadsheets and Data Analysis - Using Excel - Analyzing Data - mean (average) - median - variance - standard deviation - Plotting Data - linear/linear plot - linear/log plot - log/log plot - error bars - “trendlines” (i.e. curve-fitting) - histograms Dr. Mike Nofziger 2014 Workshop 1-2
OPTICS IS… LIGHT WORK
OPTICS IS… BIG The UofA Steward Observatory Mirror Lab casts mirrors up to 8.5 meters in diameter.
OPTICS IS… SMALL Micro-lenses are now made with diameters as small as ≈ 10 μm. Arrays of micro-lenses are used on the CCD sensors of many digital cameras.
OPTICS IS… HOT National Ignition Facility at Lawrence Livermore will deposit 1.8MJ in 2 nanosec onto a 2 mm diameter tritium target, heating it to 100,000,000K
OPTICS IS… COOL Laser cooling and trapping at OSC can capture and slow down individual atoms until their effective temperature is <1 μK.
OPTICS IS… FAST A 9 micron fiber can carry data at a rate of 10 Gbit/sec. Using dense wavelength-division multiplexing (DWDM, 16 wavelengths), 2,000,000 simultaneous phone conversations can be transmitted through a single fiber.
OPTICS IS… SLOW Using a new process, it now takes “only” 27 days to grow KDP crystals to this size for frequency multiplication (It used to take 1 year!)
OPTICS IS… NEAR Scanning tunneling microscopy (STM) at OSC can resolve individual molucules(like these three C-60 “buckyballs”).
OPTICS IS… FAR UofA NICMOS on Hubble Space Telescope found this galaxy 12 billion light years distant. OSC contributions to HST include discovery of the original out-of-focus problems.
OPTICS IS… NIGHT A Gen III image intensifier can produce a useful image under starlight. You can see a 6’ tall man at a distance of 580 yards.
OPTICS IS… DAY The sulfur lamp, the size of a golf ball, produces nearly 100 times as much light as a conventional HID lamp, nearly 1000 times as much as a 40 watt tungsten lamp.
OPTICS IS… NEW LED’s are now available in three primary colors (great for displays) and in white for illumination. A violet laser diode (406nm) is a recent introduction; expect smaller spot sizes and denser data storage.
OPTICS IS… OLD In 1609, Galileo built a telescope based on an earlier design and used it to discover four of Jupiter’s moons.
OPTICS IS… ▪ Communications▪ Medical Equipment/Procedures and Life Sciences▪ Computers and Data Storage ▪ Military ▪ Telescopes and Satellites ▪ Cameras and Image Capture Devices ▪ Custom Illumination ▪ Industrial Manufacturing ▪ Metrology ▪ Nanotechnology and MEMS ▪ Research and Education… EVERYWHERE!!!
“The Nature of Light” Quantum Mechanics Physical Optics Geometrical Optics EXAMPLE: Young’s Double Slit Dr. Mike Nofziger 2014 Workshop 1-3
Light is energy, transported from one location to another via electromagnetic (EM) waves. Dr. Mike Nofziger 2014 Workshop 1-4
Characteristics of an EM wave: • EM waves are transverse waves (the electric field oscillates in a plane perpendicular to the direction of travel). • speed c (speed of light in vacuum, universally-accepted symbol) • frequencyν “nu” • wavelengthλ “lambda” • amplitude • polarization • phase Dr. Mike Nofziger 2014 Workshop 1-5
EM wave—Speed, Frequency, and Wavelength c = ν λ c = 299,792,458 m/sec. in vacuum c ≈ 300,000,000 m/sec. = 3x10⁸ m/s c ≈ 186,000 miles/s Electromagnetic Spectrum Dr. Mike Nofziger 2014 Workshop 1-6
► NYC to LA ≈ 1/62 sec. (62 trips in one second!!) ► sun-to-earth ≈ 8 min. ► Earth-to-Mars = 9-16 min. (depending on where Mars is) ► Proxima Centauri-to-earth = 4.3 years (Proxima Centauri is the closest star to our own sun, 4.3 light-years away) ► A light-year is defined as the distance light travels (in the vacuum of outer space) in one year: EM wave—Speed of Light in vacuum (or ≈ in air) Hubble eXtreme Deep Field (XDF) image shows: ▪ galaxies 13.2 billion light years distant (galaxies that are 13.2 billion years old) Dr. Mike Nofziger 2014 Workshop 1-7
EM wave—Speed of Light in glass ► Light traveling through a media like glass has a slower velocity than in air. The frequency is the same (constant) but the velocity is slower. ►vm < c ► n ≡ c/vm ; vm = c/n where n ≡Refractive Index and c = speed of light in air ►n ≥ 1 for any material; n = 1.5 for a typical type of optical glass Dr. Mike Nofziger 2014 Workshop 1-8
Refractive Index of Different Materials • water 1.33333 • glass 1.46 to 1.76 (typically 1.5 is used) • plastic 1.4 • air 1.0 • Oil 1.6 • Diamond 2.42 • Germanium 4 • Silicon 3.4 ► A graph of refractive index vs. wavelength is called a dispersion curve: Dr. Mike Nofziger 2014 Workshop 1-9
Basics of Data Analysis:●Mean (average) of a sample populationSample Mean Example: (1,2,3,4,5,6,7,8,9,10) Dr. Mike Nofziger 2014 Workshop 1-10
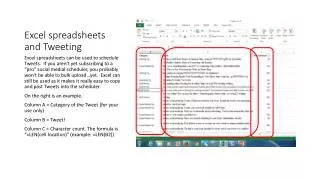
Basics of Data Analysis: In Excel●Sample Mean =(A1+A2+A3+A4+A5+A6+A7+A8+A9+A10)/10 =SUM(A1:A10)/COUNT(A1:A10) =AVERAGE(A1:A10) Dr. Mike Nofziger 2014 Workshop 1-11
Basics of Data Analysis:●Sample Variance Example: (1,2,3,4,5,6,7,8,9,10)(1)(2) Dr. Mike Nofziger 2014 Workshop 1-12
Basics of Data Analysis:●Sample Standard Deviation Example: (1,2,3,4,5,6,7,8,9,10)(1)(2)(3) Dr. Mike Nofziger 2014 Workshop 1-13
Plotting Data: In Excel●Linear-Linear ●Log-Log Dr. Mike Nofziger 2014 Workshop 1-14
Plotting Data: In Excel●Linear-Linear ●Log-Log Dr. Mike Nofziger 2014 Workshop 1-15
Plotting Data: In Excel●Linear-Linear ●Log-Log Dr. Mike Nofziger 2014 Workshop 1-16
Plotting Data: In Excel●Linear-Linear Dr. Mike Nofziger 2014 Workshop 1-17
Computer Exercises:In Excel●Michelson’s “Speed of Light” Data Set (measured values of “c”)- Find the mean, variance, and standard deviation of his values- Plot histograms of his data - Plot a “best-fit” Gaussian distribution =NORMDIST(x, mean, standard dev, FALSE)●“Old Faithful Eruptions” Data Set - Plot histograms of the data Dr. Mike Nofziger 2014 Workshop 1-18