Download
1 / 6
60 likes | 196 Views
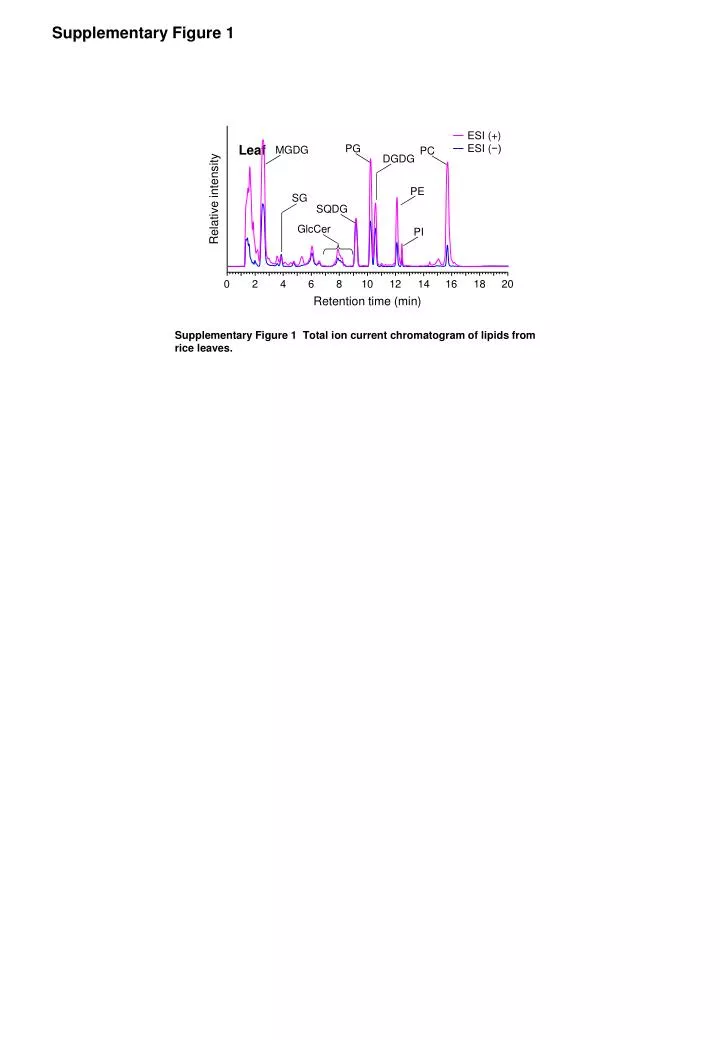
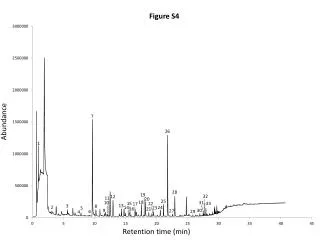
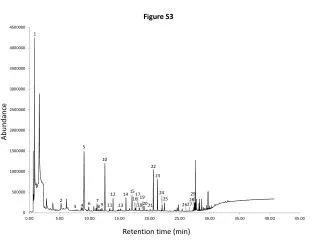
ESI (+) ESI ( −). 0. 2. 4. 6. 8. 10. 12. 14. 16. 18. 20. Supplementary Figure 1. Leaf. PG. MGDG. PC. DGDG. PE. SG. Relative intensity. SQDG. GlcCer. PI. Retention time (min). Supplementary Figure 1 Total ion current chromatogram of lipids from rice leaves. 100. 75. 50.

E N D
ESI (+) ESI (−) 0 2 4 6 8 10 12 14 16 18 20 Supplementary Figure 1 Leaf PG MGDG PC DGDG PE SG Relative intensity SQDG GlcCer PI Retention time (min) Supplementary Figure 1 Total ion current chromatogram of lipids from rice leaves.
100 75 50 25 0 300 300 400 400 500 500 600 600 700 700 800 800 900 900 1000 1000 1100 1100 100 75 50 25 0 Supplementary Figure 2 A m/z 416.353 (m/z 1034.535) Gal (⊿162) Glc (⊿162) Glc (⊿162) Xyl (⊿132) Relative Intensity (%) m/z 578.403 m/z 902.515 m/z 740.458 m/z B m/z 423.319 m/z 638.404 (m/z 1094.549) N-MeAnth (⊿151) Ara (⊿132) Glc (⊿162) Glc (⊿162) Relative Intensity (%) m/z 451.319 m/z 770.439 m/z 932.496 m/z 469.330 m/z Supplementary Figure 2. Structural characterization of triterpenoid saponins. (A) Positive MS/MS of tomatine, and (B) avenancin A-1 are displayed. The m/z values of precursor ions are shown in parentheses. Gal, galactose; Glc, glucose; Xyl, xylose; Ara, arabinose; N-MeAnth, N-methylanthranilic acid.
100 75 50 25 0 0 2 4 6 8 10 12 14 16 18 20 Supplementary Figure 3 A m/z 1088.677, [M+NH4]+ of 34:6 TGDG m/z 1093.628, [M+Na]+ of 34:6 TGDG Relative Intensity (%) m/z 1109.600, [M+K]+ of 34:6 TGDG 900 950 1000 1050 1100 1150 1200 1250 m/z B 34:6 TGDG Relative intensity Col-0 tgd3 tgd3 not detected WT -2.9 1.0 2.9 Retention time (min) C m/z 1089.678, [M+NH4+1]+ of 34:6 TGDG m/z 1093.634, [M+Na]+ of 34:6 TGDG m/z 1088.671, [M+NH4]+ of 34:6 TGDG Supplementary Figure 3 TGDG in tgd3 mutant. (A) Positive MS of TGDG in tgd3 mutant (tR 12.5 min). (B) Analysis of 34:6 TGDG in the wild type and tgd3 mutant. The intensity of extracted ion chromatogram of [M+NH4]+ of 34:6 TGDG in the tgd3 is set as 100%. The baseline is shifted for convenience. (C) Heat map expression of profiles of molecular-related ions of TGDG in wild type and tgd3 mutant. Each colored bar within a column represents an ion detected by positive LC-MS in the crude lipid extracts of the wild type and tgd3 mutants (biological replicates = 4). Peak picking and alignments were performed using Shimadzu Profiling Solution software (tolerance for m/z variation, 20 mDa; noise level, 2e5; tolerance for tRvariation, 0.1 min). Deisotope and deconvolution procedures were omitte. Peak intensities were normalized based on [M+H]+ of internal standard. The color of each bar represents the z-scored intensity of the ions of the corresponding lipid species.
Supplementary Figure 4 A (m/z 953.5, [M+HCO2]– ) 100 m/z 629.312 m/z 907.520, [M–H]– 75 Relative Intensity (%) 2×Gal–2×H2O (⊿324) 50 25 0 300 400 500 600 700 800 900 1000 m/z B (m/z 953.5, [M+HCO2]– ) 100 m/z 907.521, [M–H]– 75 Relative Intensity (%) m/z 629.314 50 2×Gal–2×H2O (⊿324) 25 0 300 400 500 600 700 800 900 1000 m/z Supplementary Figure 4. Structural characterization of two types of 34:6 DGDG (A) Negative MS/MS of 34:6 bGal(1→6)bGalDG and (B) 34:6 aGal(1→6)bGalDG are displayed. The m/z values of precursor ions are shown in parentheses
1 2 3 4 5 6 7 8 1.0 0.8 0.6 0.4 0.2 0.0 -0.2 -0.4 -0.6 -0.8 -1.0 Supplementary Figure 5 A 40 3 SD 30 fad6-1 2 SD 20 10 Pred. Comp. 1 0 -10 -20 Col-0 2 SD -30 3 SD -40 Num B Supplementary Table 2 p(corr) Supplementary Table 3 -0.3 -0.2 -0.1 0 0.1 0.2 w[1]P Supplementary Figure 5.OPLS-DA of lipidome data of ats1-1 and wild type. (A) Score scatter plot (R2Y=0.996, Q2=0.990, R2X=0.698). The confidence intervals correspond to the 2 or 3 sigma limits, i.e., 2 or 3 standard deviations of the vectors is displayed. (B) S-plot. The variables that changed most and have a strong contribution for class separation are circled. Details of variables circled in upper right and lower left are shown in Supplementary Tables 2 and 3.
40 30 20 10 0 -10 -20 -30 -40 1 2 3 4 5 6 7 8 Supplementary Figure 6 A 3 SD fad7-2 2 SD Pred. Comp. 1 Col-0 2 SD 3 SD Num B 1.0 0.8 Supplementary Table 4 0.6 0.4 0.2 p(corr) 0.0 -0.2 Supplementary Table 5 -0.4 -0.6 -0.8 -1.0 -0.3 -0.2 -0.1 0 10 20 w[1]P Supplementary Figure 6.OPLS-DA of lipidome data of ats1-1 and wild type. (A) Score scatter plot (R2Y=0.990, Q2=0.985, R2X=0.736). The confidence intervals correspond to the 2 or 3 sigma limits, i.e., 2 or 3 standard deviations of the vectors is displayed. (B) S-plot. The variables that changed most and have a strong contribution for class separation are circled. Details of variables circled in upper right and lower left are shown in Supplementary Tables 4 and 5.


![average colonic transit time [min]](https://cdn2.slideserve.com/3800221/slide1-dt.jpg)