Download
1 / 42
420 likes | 518 Views
Energy Efficiency & Utility Profits: Aligning Incentives with Public Policy. Rhode Island GHG Process 26 April 2007 Rick Weston. About RAP. Non-profit organization formed in 1992 by former utility regulators Funded by: The Energy Foundation and other charitable organizations US DOE and

E N D
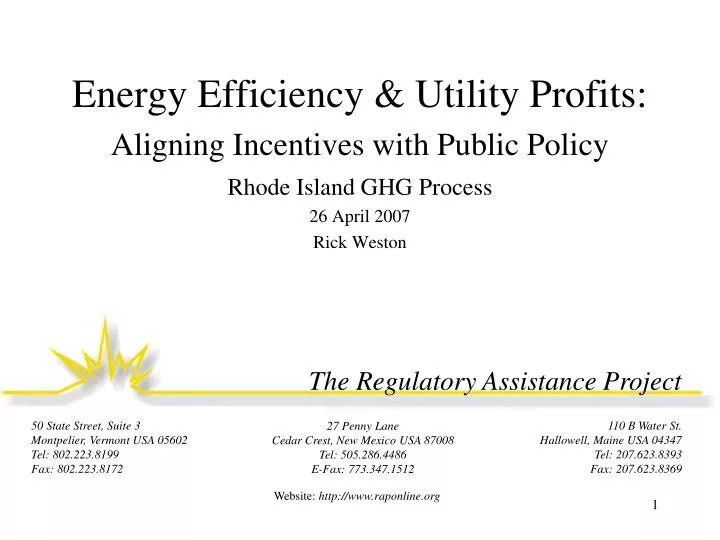
Energy Efficiency & Utility Profits:Aligning Incentives with Public Policy Rhode Island GHG Process 26 April 2007 Rick Weston Website: http://www.raponline.org
About RAP • Non-profit organization formed in 1992 by former utility regulators • Funded by: • The Energy Foundation and other charitable organizations • US DOE and • US EPA • Provides workshops and educational assistance to regulators and other government agencies
Traditional Regulatory Methods Provide Strong Disincentives for Customer-Sited Resources • Utility revenues and profits are linked to unit sales (kW, kWh, therms, etc.) • Loss of sales due to successful acquisition of energy efficiency and DG/CHP will lower utility profitability • The effect may be quite powerful. . .
Revenue Change Impact on Earnings % Change in Sales Pre-tax After-tax Net Earnings % Change Actual ROE 5.00% $9,047,538 $5,880,900 $15,780,900 59.40% 17.53% 4.00% $7,238,031 $4,704,720 $14,604,720 47.52% 16.23% 3.00% $5,428,523 $3,528,540 $13,428,540 35.64% 14.92% 2.00% $3,619,015 $2,352,360 $12,252,360 23.76% 13.61% 1.00% $1,809,508 $1,176,180 $11,076,180 11.88% 12.31% 0.00% $0 $0 $9,900,000 0.00% 11.00% -1.00% -$1,809,508 -$1,176,180 $8,723,820 -11.88% 9.69% -2.00% -$3,619,015 -$2,352,360 $7,547,640 -23.76% 8.39% -3.00% -$5,428,523 -$3,528,540 $6,371,460 -35.64% 7.08% -4.00% -$7,238,031 -$4,704,720 $5,195,280 -47.52% 5.77% -5.00% -$9,047,538 -$5,880,900 $4,019,100 -59.40% 4.47% How Changes in Sales Affect Earnings
An Alternative Approach • “Throughput” incentive is at odds with a requirement to meet demand for present and future demand for service at the lowest total cost • The throughput incentive inhibits a company from invest in energy efficiency, even when it’s the least-cost resource, and it encourages the company to promote incremental sales, even when they are wasteful • Policies should, instead, align utilities’ profit motives with public policy: the acquisition of all cost-effective resources, in particular energy efficiency, DG, and CHP • Decoupling, strong regulatory and legislative policy support, and industry leadership are a part of the solution
Addressing Utility Incentives for EE and DG/CHP • Net Lost Revenue/Expense Recovery • Decoupling utility revenues from sales volume • Providing positive incentives for meeting efficiency goals
Net Lost Revenue Recovery • Adjustment that tracks the implementation of energy efficiency and, uses statistical tools, determines net lost revenues due to customer-sited resources • Net lost revenue = Gross lost revenue – costs avoided • Recovery of net lost revenue can be contingent on achieving certain EE and other program goals • General approach adopted by many states in the 90s • Still used in several, including Kentucky and Nevada • Unfortunately, net lost revenue recovery does not remove the throughput incentive • Company still makes money on sales
Revenue-Profit Decoupling: What is it? • Breaks the mathematical link between sales volumes and profits • Objective is to make profits levels immune to changes in sales volumes • This is a revenue issue • This is not a pricing issue • Not intended to decouple customers bills from consumption • Unit-based pricing approaches are to be retained • Customers continue to see the cost implications of their consumption decisions, while the utility’s risks associated with variations in sales due to efficiency are mitigated
Revenue Decoupling:The Essential Concept • Basic Sales-Revenue Decoupling • Utility “base” revenue requirement determined with traditional rate case • Each future period has a calculable “allowed” revenue requirement • Differences between the allowed revenues and actual revenues are tracked on an average use per customer or other basis • The difference (positive or negative) is flowed back to customers in a small adjustment to unit rates
Cost Drivers • In the long-term • Demand for electricity service is the primary driver of costs • But in the short-term (the rate-case horizon) • Utility costs vary more directly with numbers of customers than with sales • Particularly true of unbundled distribution service, where the marginal costs of delivery are, on average, very low or nil, but for which the costs of acquiring and serving customers are significant and recurring
Revenue-Per-Customer Decoupling • Holds class average revenues-per-customer (RPC) constant • Or may have a periodic increase or decrease in average revenues-per-customer • Based on prior rate case values • Monthly (or other periodic) adjustment mechanism similar to traditional fuel and purchase power adjustments • See Maryland (BG&E) for an example
“Advanced” Decoupling • RPC value periodically adjusted for inflation and/or productivity • Can be combined with performance goals and incentives • Adjustments can be bounded (SDG&E/SoCalGas) and/or “shared” with customers (PG&E/Northwest Natural Gas, Oregon) • California has the most comprehensive decoupling and PBR mechanisms
Decoupling Examples: • Maryland – Gas Utilities (in place), PEPCO (filed) • North Carolina – Gas Utilities • California – 3 IOUs Electric & Gas Utilities • Oregon – Northwest Natural Gas • New Jersey (NJNG – Awaiting approval order) • Utah (Questar) • Indiana & Ohio (Vectren)
Decoupling: MarylandBaltimore Gas & Electric • Decoupling mechanism for residential and general service gas customers • Straight revenue-per-customer method • Based on prior rate case test year for base revenue per customer • Monthly adjustment mechanism similar to traditional fuel and purchase power adjustments • BG&E program formed the basis of the MADRI Model Rate Rider
Maryland:BG&E’s Decoupling • Allowed Revenues = Test Year Average Use per Customer * No. of Customers * Delivery Price • Adjustment to Delivery Price = (Allowed Revenues - Actual Revenues) ÷ Estimated Sales • Any difference between actual and estimated sales is reconciled in a future month • Calculated separately for each class • Calculations of the billing adjustments are filed monthly with the Public Service Commission
MADRI Model Revenue Stability Rider • Mid-Atlantic Distributed Resources Initiative • Aimed at developing state and regional policies and programs to increase deployment of distributed energy resources (EE, DG/CHP, other demand response) in 5 mid-Atlantic states • Developed model decoupling approach, based on BG&E program • PEPCO proposals based on the model
Incentives • Financial rewards for superior performance in achieving desired policy outcomes • Increase ROE for cost-effective EE and other specified investments • Shared savings • Payments for meeting specified performance targets • Available in a number of states • E.g., AZ, CT, MA, MN, NH, NV, VT
New Mexico: Example of Clear Policy Direction • It serves the public interest to support public utility investments in cost-effective energy efficiency and load management by removing any regulatory disincentives that may exist and allowing recovery of costs for reasonable and prudently incurred expenses of energy efficiency and load management programs • The commission shall identify any disincentives or barriers that may exist for public utility expenditures on energy efficiency and load management and, if found, ensure that they are eliminated in order that public utilities are financially neutral in their preference for acquiring demand or supply-side utility resources New Mexico Statutes, Chapter 62-17-2
Decoupling: North CarolinaAn Interesting Read • North Carolina’s three major gas utilities have decoupling mechanism • Expressed importance of highly volumetric rate structures and lower fixed customer charges • Good overall discussion of policy framework for decoupling • Rejected higher fixed-charge approach as unpopular with customers • Rejected Attorney General’s argument that decoupling would penalize customers for conserving
North Carolina: Customers & Shareholders • “Different usage patterns and tariffs of industrial customers” provide good cause to exclude class from mechanism • Approved as an experimental tariff limited to no more than 3 years • Required utility contribution toward conservation programs (e.g. $500,000 per year for Piedmont) • Required utility to work with the Attorney General and the Public staff to develop appropriate and effective conservation programs to assist its residential and commercial customers
North Carolina Rationale for Decoupling • Recognized conservation has potential for financial harm to the utility and its shareholders • Cited number of benefits: Improved opportunities for conservation of energy resources, savings for customers, downward pressure on wholesale gas prices, helping utility recovery of margin and a reasonable return • Decoupling better aligns interests of Company and customers with respect to conservation • Commission on Shareholder Risk: “In a period of declining per-customer usage, a mechanism that decouples recover of margin from usage, without requiring the utility to file frequent rate cases or increase unpopular fixed charges, clearly reduces shareholder risk.”
Which Brings Us To:A Policy Tale of Two Utilities • Rising revenue-per-customer utilities: • Experience rising earnings between rate cases • Typical of many electric utilities • Declining revenue-per-customer utilities: • Experience declining earnings between rate cases • Typical of many gas utilities • Under reasonable assumptions, not symmetric between rising and declining cases • Usually driven by differences in the average consumption between new and old customers • Policy question: Should decoupling be “profit neutral” relative to future such profit expectations?
California Decoupling Basics • Part of an aggressive and comprehensive policy framework designed to deploy cost-effective energy efficiency • Covers SDG&E/SocCalGas, PG&E and SCE • Tracks difference between allowed revenues and actual revenues • Trued up each year to that year’s authorized revenues • Revenue requirements are adjusted each year for inflation • Each utility has individual mechanisms for determining annual revenue requirements
California Case Specifics:Company Plan Features • Southern California Edison • Citing: • Poor financial health of company • Changed circumstances since such adjustments were rejected (20 years ago) • Commission approved “non-test year” revenue requirement adjustments • Implemented revenue balancing account for over- under-collections of revenue adjustment • San Diego Gas & Electric and SoCalGas • Each year’s revenue requirement is determined by the previous year’s base margin adjusted by CPI • Minimum and maximum authorized adjustments (in 3%-4% range) • Balancing account for adjustment collections • Sharing mechanism
Pacific Gas & Electric • Separate Distribution and Generation mechanisms: • DRAM (Distribution revenue adjustment mechanism) and • UGBA (Utility Generation Balancing Account) revenue adjustment mechanisms • Allowed revenues: annual CPI-based attrition adjustments for 2004-2006, with following minimums and maximums:
Decoupling: Oregon Northwest Natural Gas • Defers and subsequently amortizes 90 percent of the margin differentials in the residential and commercial customer groups • Average customer margin-per-therm calculation • Calculated Monthly • Places weather risk on utility
MADRI Model Rule • Used BG&E Rate Rider as starting point • Model Rule is product of collaborative stakeholder process • Available at: http://www.raponline.org/Feature.asp?select=78 • Tracks on demand and energy basis • Currently 60-day lag between consumption & recovery – may present rate design issue • Lag can be eliminated with a “use and file” approach • As written, places weather risk on customer – but this is not a policy position per se
Lost Revenue/Expense Approaches • Kentucky • Nevada
Lost Revenue/Expense Approaches:Kentucky • Allows lost revenue recovery for both electric and gas DSM programs. • Recovery mechanisms are determined on a case-by-case basis • Utilities can recover • Full costs of commission-approved demand-side management programs and • Revenues lost • Incentives designed to provide financial rewards to the utility for implementing cost-effective demand-side management programs
Lost Revenue/Expense Recovery Approaches: Nevada • Utility required to track and separate costs • For Commission approved action plan programs, utility may recover labor, overhead, materials, incentives paid to customers, advertising, marketing and evaluation
Positive Incentives • Arizona • Connecticut • Massachusetts • New Hampshire • Nevada • Vermont
Positive Incentives: APS Performance Incentives • Funding for DSM • Base rates ($10 million per year) and • Through implementation of an adjustor (average of $6 million per year) • APS recovers performance incentive for DSM program results • Share of the net economic benefits (benefits minus costs), • Maximum reward of 10% of DSM spending • Credits against test year base revenue requirement • Low income bill assistance • APS was obligated to spend $13 million in 2005 on DSM projects.
Positive Incentives: Connecticut Performance Incentives • Utilities managing conservation & load management programs are eligible for “performance management fees,” tied to performance goals approved by the ECMB and DPUC, including lifetime energy savings and demand savings, and other measures • Incentives are available for a range of outcomes from 70-130% of pre-determined goals. • 2004 utilities collectively reached 130% of their energy savings goals, and 124% of their demand savings goals. • Received performance management fees of $5.27 million • 2006 joint budget anticipates $2.9 million in performance incentives.
Positive Incentives: Massachusetts Performance Incentives • NSTAR • After-tax shareholder incentive of five percent • Level of performance bounded from 75 percent to 110 of design level performance • Regulatory finding: Incentives must be large enough to promote good program management, but small enough to leave almost all of the energy efficiency funds to directly serve customers
Positive Incentives:Minnesota Performance Incentives • 1999 – Utilities receive a percentage of total net benefits when performance levels are met or exceeded • Net Benefits are calculated by subtracting each utility’s program costs from the avoided costs resulting from each utility’s Conservation Improvement Plan (CIP) investment • Avoided cost estimates ($/kw,$/kWh) saved remain constant for the duration of approved biennial CIP
Positive Incentives:New Hampshire Performance Incentives • Two separate incentives • Cost-effectiveness incentive • Utility must achieve Actual to Projected Cost-Effectiveness ratio of 1.0 or higher • Incentive is 4% of Planned Energy Efficiency Budget multiplied by the ratio of Actual Cost-Effectiveness to Planned Cost-Effectiveness • Energy Savings incentive • Utility must achieve 65% of planned energy savings • Incentive is 4% of Planned Energy Budget, multiplied by ratio of Actual Energy Savings to Planned Energy Savings • Maximum incentive in each sector (residential and commercial/industrial) is 12% • Sectors are calculated separately
Positive Incentives:Nevada Incentives • DSM Incentive: Bonus rate of return for DSM investments 5% higher than authorized rates of return for supply investments • Critical Facilities Incentive: Facilities may be designated “critical” for reliability, diversity of supply- and demand-side resources, development of renewable resources, fulfilling statutory mandates and/or retail price stability • Incentives for critical facilities may include: • Enhanced return on equity on facility over its life • CWIP treatment • Creation of “regulatory asset” account
Positive Incentives:Vermont Performance Incentives • Incentive in effect for 2000-2002 • Efficiency is responsibility of Efficiency Vermont, the state’s “Energy Efficiency Utility” (EEU) • EEU receives performance incentives for meeting or exceeding specific goals in contract between Vermont’s Public Service Board (PSB) and EEU • Incentive categories: • Program Results Incentives (electricity savings &resource benefits) • Market Effects Incentives (significant market transformation) • Activity Milestones Incentive (exemplary performance for rapid start-up and/or infrastructure development ) • Incentives capped at $795,000 over three years
Resources • Website: www.raponline.org • E-mail: • Rapweston@aol.com • Rapwayne@aol.com • MADRI Model Revenue Stability Rider • http://www.energetics.com/MADRI/pdfs/Model_Revenue_Stability_RateRider_2006-05-16.pdf • RAP Efficiency Policy Toolkit: • http://www.raponline.org/Pubs/General/EfficiencyPolicyToolkit.pdf