Download
1 / 19
210 likes | 402 Views
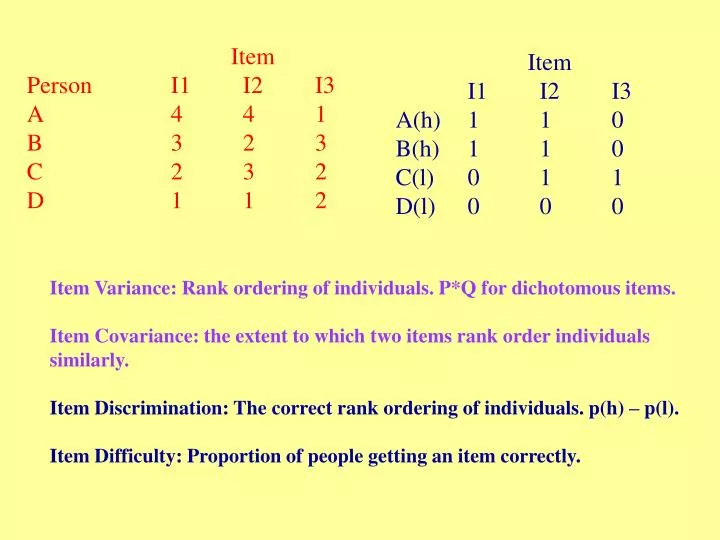
Item Person I1 I2 I3 A 4 4 1 B 3 2 3 C 2 3 2 D 1 1 2. Item I1 I2 I3 A(h) 1 1 0 B(h) 1 1 0 C(l) 0 1 1 D(l) 0 0 0. Item Variance: Rank ordering of individuals. P*Q for dichotomous items. Item Covariance: the extent to which two items rank order individuals similarly.

E N D
Item Person I1 I2 I3 A 4 4 1 B 3 2 3 C 2 3 2 D 1 1 2 Item I1 I2 I3 A(h) 1 1 0 B(h) 1 1 0 C(l) 0 1 1 D(l) 0 0 0 Item Variance: Rank ordering of individuals. P*Q for dichotomous items. Item Covariance: the extent to which two items rank order individuals similarly. Item Discrimination: The correct rank ordering of individuals. p(h) – p(l). Item Difficulty: Proportion of people getting an item correctly.
Item Variance Item Difficulty
Maximum item discrimination D Item difficulty p The relationship between item difficulty and discrimination.
Pk 0.0 0.1 0.3 0.5 0.7 1.0 0.7 0.5 0.3 0.1 0.0 Ph Combinations of Ph and Pk for which the Maximum Correlation is 1.0, 0.7, 0.5, 0.3, 0.1, and 0.0
T X X Reliability is the extent to which your observed score represents your true score
T X Reliability is the extent to which individual differences or rank ordering of individuals based on the observed scores represent that based on the true scores. One operations of this definition is the correlation between observed scores and true scores, rXT, which is called reliability index. Another operation is the squared correlation between observed score and true score or the proportion of observed score variance that is true score variance, or proportion of the consistent rank ordering, rXT2
Test-retest Parallel form Split half Internal consistency X’ X In reality, it is the extent to which two tests yield similar results or similar rank ordering of the individuals, r2XX’
Systematic error: 1. Systematic in relation to all the examinees: e.g., an interviewer overrates everyone. 2. systematic in relation to different groups of people. This is test bias or extraneous variance and is thus validity threat: e.g., non English speaker systematically suffer in IQ test because of the language difficulties. 3. systematic in relation to individuals, test anxiety. This is also not considered in classic theory. Random Error: EET = 0, e.g., not all high ability persons only make lucky errors. sE 2 is constant, i.e., the average fluctuation from the true score is same across individuals, although each time, your observed score may deviate much or not much from the true score. EEE’ = 0, e.g., unlikely that you have the luck to happen to see the answer key again when you take the same test.
When ρxx' = 1, • the measurement has been made without error (e=0 for all examinees). • X = T for all examinees. • all observed score variance reflects true-score variance. • all differences among observed scores are true score differences. • the correlation between observed scores and true scores is 1. • the squared correlation between observed scores and true scores is 1. • the correlation between observed scores and errors is zero. • When ρxx’ = 0, • only random error is included in the measurement. • X = E for all examinees. • all observed score variance reflects error variance. • all differences among observed scores are errors of measurement. • the correlation between observed scores and true scores is 0. • the squared correlation between observed and true is 0. • the correlation between the observed scores and errors is 1. • When ρxx’ is between zero and 1, • the measurement include some error and some truth. • X = T + E. • observed score variance include true-score variance and error variance. • differences among observed scores reflect true-score differences and error differences. • the correlation between observed scores and true scores, i.e., reliability index, ranges between 0 and 1. • the squared correlation between observed scores and true scores, i.e., reliability coefficient, ranges between 0 and 1. • the correlation between observed scores and error is the square root of 1 – reliability.
Validity The Classics Different kinds of validity depending on test use. Content validity Construct validity (criterion related validity) Predictive validity Concurrent validity The Contemporary A unified approach to all validity issues in validating a test. Construct Underrepresentation Construct Irrelevant Variance Validity Threat from Response Process Validity Generalization Consequence Validity
Content Validity 1. Define domain content Table of specifications
Construct Validity: Internal Structure 0.66 0.82 0.74 0.67 0.82 0.54 0.65 0.40 0.61 0.58 0.46 0.39 0.52 0.64 Warmth Physical Punishment 0.88 Authoritative Parenting 0.84 0.79 0.72 0.38 0.80 0.56 0.37 0.82 0.57 0.63 0.74 0.67 0.68 0.93 Non Reasoning Inductive Reasoning - 0.38 0.94 0.78 0.64 0.69 0.65 0.48 0.59 0.68 0.62 0.43 -0.04 0.65 0.64 Easygoing Responsiveness Authoritarian Directiveness Authoritarian Parenting 0.85 1.01 0.65 0.05 0.18 0.42 0.48 0.59 0.68 0.62 Democratic Participation 1.04 Verbal Hostility
Communication Avoidance Perceived Social Competence Time 1 .59 .50 .54 .55 .58 .73 -.38 -.16 -.24 .54 Social Withdrawal .96 .94 .94 -.13 Perceived Social Competence Time 2 .65 .62 .66 .23 Assertive Leadership -.13 -.35 .90 .70 .27 Peer Acceptance Time 1 .17 Single Indicator .87 .89 .82 Behavioral Aggression -.27 .24 -.15 -.17 .60 .65 .67 .69 Verbal Aggression Peer Acceptance Time 2 Single Indicator -.20 Construct Validity: Network Relations
Criterion-Related Validity SAT A-Level Concurrent A-Level University GPA Predictive
Distribution of criterion scores for selected group Selected group Criterion Distribution of scores on the criterion if no examinees were excluded Qualifying score Rejected Selected Test Scores Restriction of Range Effect