Download
1 / 15
150 likes | 162 Views
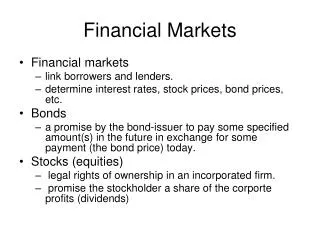
Recovery and Financial Markets. John Ryding, Chief Market Economist February 20, 2002. Recovery Scorecard Table. Source: Bear, Stearns & Co. Inc. Bear Stearns Industrial Metals Index. 01/01/96 = 100. Source: Bear, Stearns & Co. Inc. Real Personal Income. 12-month change, %.

E N D
Recovery and Financial Markets John Ryding, Chief Market EconomistFebruary 20, 2002
Recovery Scorecard Table Source: Bear, Stearns & Co. Inc.
Bear Stearns Industrial Metals Index 01/01/96 = 100 Source: Bear, Stearns & Co. Inc.
Real Personal Income 12-month change, % Shading = recession Source: Commerce Department
Real Corporate Profits 4-quarter change, % Shading = recession Source: Commerce Department
Profit Fundamentals Source: Bear, Stearns & Co. Inc.
GDP and S&P 500 Growth Following Recession Source: Bear, Stearns & Co. Inc.
GDP Growth and S&P 500 Following Recession Source: Bear, Stearns & Co. Inc.
Price of Gold $ per troy ounce Source: Haver Analytics
Trade-Weighted U.S. Dollar 3/73 = 100 Source: Haver Analytics
Nominal Fed Funds Rate percent Source: Haver Analytics
Real Yield on 10-Year Treasury Note percent Source: Haver Analytics
10-Year to 2-Year Treasury Spread basis points Source: Federal Reserve
2-Year Treasury to Fed Funds Spread basis points Source: Federal Reserve
Baa Corporate Bond Spread Baa minus 10-yr Treasury, basis points Source: Moody’s; Federal Reserve