Download
1 / 8
80 likes | 172 Views
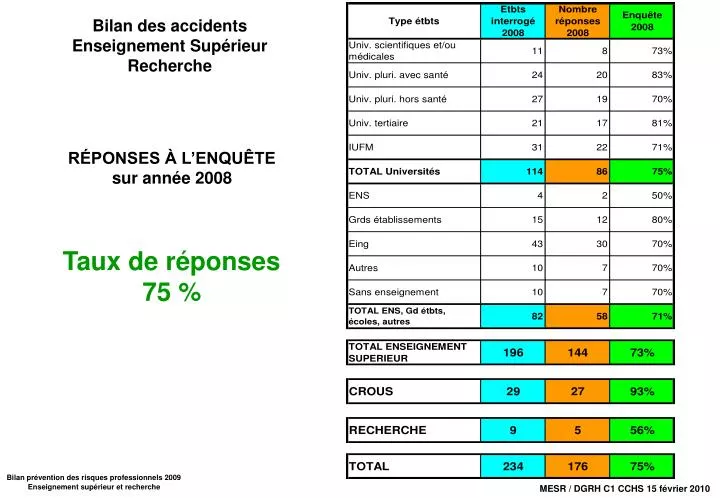
Bilan des accidents Enseignement Supérieur Recherche. RÉPONSES À L’ENQUÊTE sur année 2008. Taux de réponses 75 %. >90 jours. 1 à 3 jours. Nombre jours d’arrêt. Accidents avec arrêt. 1 à 89 jours. 4 à 14 jours. Bilan des accidents 2008 Sup Recherche. Accidents. Accidents. Trajet.

E N D
Bilan des accidents Enseignement Supérieur Recherche RÉPONSES À L’ENQUÊTE sur année 2008 Taux de réponses 75 %
>90 jours 1 à 3 jours Nombre jours d’arrêt Accidents avec arrêt 1 à 89 jours 4 à 14 jours Bilan des accidents 2008 Sup Recherche
Accidents Accidents Trajet Trajet 25% 25% 3% Accidents 3% Accidents 72% Stricto sensu 72% Stricto sensu Accidents Accidents Mission Mission Accidents Accidents Trajet Trajet 25% Accidents 25% Mission Accidents avec arrêt 3% Accidents 3% Accidents Accidents Stricto sensu 72% Mission Stricto sensu 72% Bilan des accidents 2008 Sup Recherche Tous les personnels ENSEIGNANTS TECHNICIENS ADMINISTRATIFS
65.7 Cantines IFA = nombre d'accidents avec arrêt X 1.000 nombre de salariés INDICE de FRÉQUENCE 49,9 50,00 45,00 40,00 38 35,00 30,00 Régime général Recherche scien. techno Laboratoires chimie 25,00 20,00 15,00 11,12 6.71 5.6 9,39 8,55 10,00 7,16 5,71 5,97 6,16 6,04 5,97 3,71 4,65 3,67 2,95 5,00 0,00 CNRS CROUS INSERM Recherche U. Tertiaire Universités Ecoles Ingénieurs Grands établissements Tous les établissements U. Pluridisciplinaire hors santé Recherche hors CNRS INSERM U. Pluridisciplinaires avec santé U. Scientifiaques et/ou médicales Etablissements hors universités Bilan des accidents 2008 Sup Recherche
14,87 9,84 8,55 1,84 16,00 14,00 12,00 9,25 10,00 8,00 5,81 5,32 6,00 4,00 1,14 2,00 0,00 Enseignants Techniciens Administratifs Tous les Catégories Bilan des accidents 2008 Sup Recherche Répartition des accidentspar catégorie de personnel TAUX de FRÉQUENCE INDICE de FRÉQUENCE ENSEIGNANTS TECHNICIENS ADMINISTRATIFS IFA = nombre d'accidents avec arrêt X 1.000 nombre de salariés TF = nombre d'accidents avec arrêt X 106 nombre d'heures travaillées
23,6% 20,9% 18,0% 7,6% 6,7% 5,9% 5,7% 3,4% 2,5% 0,9% 0,6% 0,5% 0,4% 0,4% 0,3% 0,3% 0,0% hernie gelure brûlure fracture lumbago Asphyxie amputation commotion Intoxication plaie/piqure corps étranger Trouble auditif Perte de vision Lésions non-définies électrisation / électrocution contusion / écrasement musculaire ou ligamentaire Bilan des accidents 2008 Sup Recherche Lésion des accidents 25,0% 20,0% 15,0% 10,0% 5,0% 0,0%
24,5% 16,0% 34,1% 12,2% 24,3% 9,6% 8,3% 8,3% 8,7% 5,7% 4,9% 1,8% Main MbreSup. MbreInf. Pied Tronc TêteCou Yeux Lésions Siège Autres Multiples Interne (excepté main) (excepté pied) Bilan des accidents 2008 Sup Recherche Sièges des lésions 30,0% 25,0% 20,0% 15,0% 10,0% 5,0% 0,0%
40% 36% 35% 30% 23% 25% 35% 20% 13% 15% 10% 8% 10% 4% 4% 5% 2% 1% 0% 0% Heurt Autres Agression Explosion Projection Manutention Chute d'Objet Contact-Exposition Chute de Personne Accident de la Route Bilan des accidents 2008 Sup Recherche Nature des accidents