Download
1 / 38
380 likes | 473 Views
Recontres de Moriond. Hybrid Analysis with the Pierre Auger Observatory. David Newton University of Leeds dn@ast.leeds.ac.uk. La Thuile, March 2005. Measured Energy Spectrum. Summary of some of the problems with the energy spectrum:. At low energies SD apertures can be in error

E N D
Recontres de Moriond Hybrid Analysis with the Pierre Auger Observatory David Newton University of Leeds dn@ast.leeds.ac.uk La Thuile, March 2005
Summary of some of the problems with the energy spectrum: • At low energies SD apertures can be in error • At high energies FD apertures are uncertain • Model/mass uncertainties in conversion from SD • Fluorescence Yield • Absolute calibrations of FD and SD BUT: EVENTS ABOVE 100 EeV DO EXIST
The Hybrid Concept 300-400 nm light from de- excitation of atmospheric nitrogen (fluorescence light) Fluorescence Detector • Energy + longitudinal development • Time -> direction Surface Detector • Shower size ->Energy • Time -> direction
Hybrid Reconstruction Using timing from one station + FD data gives angular reconstruction equivalent to stereo detection
Hybrid events equivalent to stereo events and superior to mono events
Hybrid Benefits • Gives 2 independent energy measurements • Only SD timings are used in geometric reconstruction. SD signals are independent and can be used to calculate separate energy measurement • Cross check of energy measurements • identify systematics in each technique • 10 % duty cycle, but... • Use quality hybrid events to 'train' the SD events • Gives high quality SD events with 100 % duty cycle
Hybrid Benefits... • Calibration can work both ways • Low quality FD events ( large atmospheric attenuation uncertainty) can use the SD energy to normalise the longitudinal profile • All FD events will be hybrid • Easy to compute aperture • Low energy threshold • Only require timing information from 1 SD station • High resolution measurements down to 1 EeV
Hybrid Benefits... • Combine FD and SD parameters used for primary identification. • Xmax , LDF slope parameter , Muon Ratio, FADC analysis...
A tour through event 673411. A hybrid event and a stereo event (nearly). Here is what one finds on the SD event display. From Coi-hueco-> From Los Leones->
Fluorescence Display Event 673411 Coi-hueco (6 pixels) Los Leones (29 pixels)
Event 673411 Hybrid Reconstruction Mono fit Hybrid fit <- SD times <- SD times <- FD times <- FD times Hybrid (Los Leones) Surface Difference Easting 465960 ± 80 465830 130 m Northing 6090234 ± 20 6090308 -74 m Theta 36.7 deg 35.9 deg 0.8 deg Phi 185.8 deg 186.7 deg -0.9 deg
Event 673411 Nemaximum = 1.4x10¹⁰ Nemaximum ~ 7x10¹⁰for energy = 1020 eV FD energy~ 2x10¹⁹ eV (preliminary) SD energy= 2.1x10¹⁹ eV
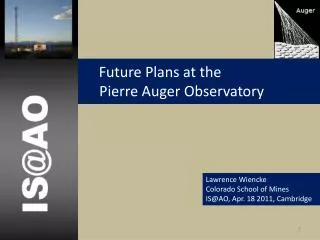
Summary... • Data taking and analysis in conjunction with installation and calibration • Hybrid observations will give high statistics, high quality events • Unambiguously determine the cosmic ray spectrum above 1018 eV • structure of the ankle • GZK features • Primary identification.
Balloon launches (p, T, Humidity..) Horizontal Attenuation Monitor Measurements at Malargue of the deviation of grams/cm2 with respect to US std atmosphere Measurement of horizontal attenuation of the atmosphere at the Auger site. Attenuation varies between 8 km and 18.5 km
Atmospheric monitoring One steerable LIDAR / Eye • during data taking • “Shoot the shower” • Raman LIDAR Backscattered light r T ~ e-β(r)
Bad night Average night VAOD = Vertical Aerosol Optical Depth 26 km <- Celeste Central Laser Facility (vertical beam + optical fibre to Celeste)
Hybrid Benefits... Primary Identification – Plot of Xmax v N(muon) for simulated Iron and proton primaries Diagonal line on 2D scatter plot, gives better separation of proton/iron components than relying on Xmax or N(muon) alone. Could use additional information (risetimes, LDF ...)
Surface Detectors • Energy calculation is model dependent – systematic uncertainty • Aperture is generally easy to calculate • although problematic at threshold energy
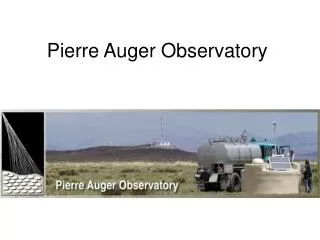
PAO Status • 12 Fluorescence Telescopes fully operational • ~ 700 + surface detectors operational • Completion of Observatory in early 2006 • Data taking and analysis in conjunction with installation and calibration • First results – August 2005
Fluorescence Detectors • Energy Measurement is calorimetric – model independent, but... • Need constant calibration of optics, electronics... • atmospheric modelling • light attenuation, re-scattered light from aerosol, Rayleigh scattering • Aperture is difficult to calculate • especially at high energy
FD Calibration light flux measured by absolutely calibrated PMT light diffusing Tyvek walls Drum: uniform camera illumination pulsed light sources, several wavelengths and intensity
Absolute calibration with the drum pixel FADC trace CCD image of the drum drum calibration: camera shadow, mirror reflectivity, mercedes, PMT sensitivity, etc., are all included! 1 FADC count ≈ 4 photons at the diaphragm
Infrared Cloud Monitor Estimate “cloud fraction” / FD camera pixel Coihueco Los Leones
Extensive Air Showers 1018 eV < E < 1021++ eV
Why Do We Study High EnergyCosmic Rays? • Offer a unique window on the ultra high energy universe • No known acceleration mechanism beyond 1015 eV • Predicted Greisen-Zatsepin-Kuzmin (GZK) steepening? • p + g2.7K -> D+-> p + p0 -> n + p+ • If E > 4 x 10¹⁹ eV 50% from within 130 Mpc • If E > 1020 eV 50% from within 20 Mpc
We'd Like to Know... • Where they come from. • Discrete sources? • Anisotropies? • Isotropic? • Extragalactic? • What they are? • Nature of the primary • The shape of the energy spectrum
Surface Detectors • Angular reconstruction from fit of the shower front to the detector trigger times • Fit Lateral Distribution Function to get ground parameter -> energy(models)
Fluorescence Detectors Angular Reconstruction Stereo detection (2 telescopes) improves the angular reconstruction
Fluorescence Detectors Energy reconstruction... Energy found by integrating under the curve
The Observatory • 3000 km2 on completion • FD eye (4 peripheral eyes, 6 telescopes each) 11000 PMTs • 1600 SD Cerenkov tanks (spacing 1.5 km) 4800 PMTs
The Fluorescence Telescope The Camera:440 PMTs on a spherical surface
The Schmidt optics Spherical aberration Coma aberration C C F C spot Diaphragm Coma eliminated C Spherical focal surface
The FD camera Production and test of all PMTs completed, failures at 1 ‰ level Light collectors to recover border inefficiencies “mercedes star” with aluminized mylar reflecting walls 440 PMTs on a spherical surface 90 cm