Download

1 / 25
250 likes | 412 Views
Dynamical forecasts of atmospheric conditions associated with North Atlantic Hurricane Activity by the Climate Forecast System (CFS) at NCEP. Muthuvel Chelliah Climate Prediction Center/NCEP/NWS Suranjana Saha Environmental Modeling Center/NCEP/NWS.

E N D
Dynamical forecasts of atmospheric conditions associated with North Atlantic Hurricane Activity by the Climate Forecast System (CFS) at NCEP Muthuvel Chelliah Climate Prediction Center/NCEP/NWS Suranjana Saha Environmental Modeling Center/NCEP/NWS
NCEP’s new Coupled Ocean-Atmosphere Climate Forecast System (CFS) Hindcast Runs Data Base Became Operational on 24 August 2004 Starts with a set of Atmosphere-Ocean Initial Conditions and medium/extended integrations proceed for about 9+ months with no interference. An extensive data base of hindcast runs (Forecast) from 1981 have been created by the Environmental Modeling Center (EMC). This study will examine how the CFS and the Hindcast data base can be used to help make NOAA’s North Atlantic Hurricane Outlooks issued every year
CFC’s Hindcast Runs1981-2003 4-Month Lead (MAR/APR) 1-Month Lead (JUN/JUL) Aug-Sep-Oct Peak of the N.Atlantic Hurricane Season 0 Month Lead (JUL/AUG) Initial Conditions from Jul 9, 10, 11, 12, 13 Jul 19, 20, 21, 22, 23 -2, -1, 1, 2, 3 Aug 1981-2003 Aug-Sep-Oct (ASO) mean forecasts made from 4-months (Mar/Apr) to 0-month (Jul/Aug) lead are considered in this study. For each lead there are a total of 15 ensemble member forecasts. Only Ensemble mean forecasts are studied here.
Some background on NOAA’s Hurricane Outlooks See poster: The 2004 North Atlantic and East Pacific Hurricane Season Summary and NOAA Outlooks Muthuvel Chelliah, Gerry Bell and Kingtse Mo
NOAA Seasonal Atlantic Hurricane Outlook August Forecast vs. Observed: 1998-2003 Hurricanes Tropical Storms 10 15 15 14 9 14 8 7 8 12 12 4 Accumulated Cyclone Energy (ACE) Major Hurricanes 240 206 5 188 4 3 135 3 122 3 2 76 Observed Forecast Range Green bars indicate climatological mean and ACE range for near-normal season (76%-120% of Median)
In general, for enhanced N.Atlantic Hurricane activity: • 1) We need to have Warmer SSTs of course, • 2) Westward Extended Upper level Tibetan Anticyclone (=> upper level easterlies), • 3) Lower/Easterly Vertical Wind Shear (200-850 hPa) across the North Atlantic, • 4) Favorable low-level African Easterly Jet and associated above normal cyclonic vorticity south of the jet generally favor enhanced levels of Hurricane Activity • –--- there are significant Tropical Multidecadal (TMM) and Interannual (ENSO) influences on the activity [Chelliah and Bell(2004), Goldenberg et al (2001),..].
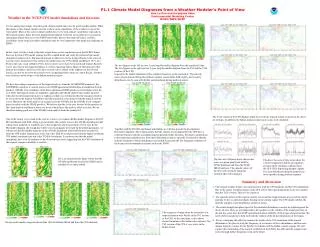
Next, we examine how good are the CFS’s 200 hPa Stream Function (representing the westward extension of the 200 mb Tibetan Anticyclone during summer) forecasts in the North Atlantic and vertical Wind Shear (200 – 850 hPa) forecasts near the Main Development Region (MDR) during the Aug-Sep-Oct (ASO) season for various forecast leads (4- through 0-month). • --First the The Stream Function • --Then the Vertical Wind Shear
CFS Forecast of (1981-2003) Mean Aug-Sep-Oct 200 mb STRMFn at 3 different Leads 2 Mon Lead (made from ICs in MAY) 4 Mon Lead (made from ICs in MAR) 0 Mon Lead (made from ICs in JUL) REANL
1981 - 2003 Mean of Aug-Sep-Oct (ASO)200 mb Stream Function CFS Forecast (4 Mon Lead) MDR NCEP/NCAR Reanalysis
Interdecadal/Interannual Variability of area (N.Atl) averaged 200 mb STRMFn ANOM in the CFS Forecasts and REANL 1981 2003 90W 0E
Time Series of Forecast and Observed Area averaged 200mb Stream Function near the MDRand ACE (North Atl. Hurr. Activity)
CFS FORECASTS of 200 mb STRMFN ANOM during contrasting seasons of N.Atlantic Hurricane Activity - 1995/1997 1995 Active N.Atlantic Hurricane Season StrmFn ANOMS +ve 1997 (Major El Nino) Inactive Season StrmFn ANOMS -ve
CFS FORECASTS of 200 mb STRMNFn ANOM during contrasting seasons of N.Atlantic Hurricane Activity - 2002/2003 2002 (Minor El Nino) Inactive Normal Hurricane Season StrmFn ANOMS -ve 2003 Active Hurricane Season
(1981 – 2003) Mean Aug-Sep-Oct (ASO)vertical Wind Shear(200-850 mb) CFS Forecast (4 Mon Lead) NCEP/NCARReanalysis MDR
CFS Forecast of Aug-Sep-Oct vertical Wind Shearat 3 different Leadsas compared to Reanalysis 4 Mon Lead (made from ICs in MAR) 2 Mon Lead (made from ICs in MAY) The bias in the CFS Fcsts over MDR improves with time 0 Mon Lead (made from ICs in JUL) REANL
Interdecadal/Interannual Variability of area (N.Atl) averaged vertical Wind Shear in the CFS Forecasts and REANL 1981 1995 2003
Time Series of Forecast and Observed Area averaged Vertical Wind Shear and ACE (North Atl. Hurr. Activity)
CFS FORECASTS of vertical Wind Shear ANOM during contrasting seasons of N.Atlantic Hurricane Activity - 1995/1997 1995 Active N.Atlantic Hurricane Season Negative ANOM CFS Forecast REANL 1997 (Major El Nino) Inactive Season Positive ANOM
CFS FORECASTS of vertical Wind Shear ANOM during contrasting seasons of N.Atlantic Hurricane Activity - 2002/2003 2002 (Minor El Nino) Inactive-Near Normal Hurricane Season Positive ANOM CFS Forecast REANL 2003 Active Hurricane Season Negative ANOM
Summary The Assessment so far ----->>>>> • CPC (along with scientists from NHC and HRD) issues the North Atlantic Hurricane Outlook in early May and an update in early August bases on the subjective evaluation of the TMM and the ENSO. CCA methods are also used to forecast future atmospheric states during the hurricane season. • CFS’s seasonal long lead dynamical forecasts of stream function, vertical wind shear, and low level tropical easterly jet in the North Atlantic appear to be useful. • The CFS forecasts will definitely help CPC with the May/August updates of the Official NOAA outlooks of the N.Atlantic (and East Pacific Hurricane) Outlook(s).