Download
1 / 12
120 likes | 127 Views
An analysis of the progress towards growth, income, and poverty targets, with implications for policy-making and monitoring. Explores the high growth rate, sectoral dynamics, inflation, and limitations in bank lending. Examines income poverty reduction, consumption patterns, inequality, and the need for sustained growth. Recommends interventions to raise productivity, invest in human and physical capital, and deepen the financial sector.

E N D
Growth, Income Poverty, and Economic Wellbeing of Households Donald Mmari REPOA
Outline • Progress towards targets • Implications for Policy • Implications for monitoring
Progress towards targets • High Growth rate over the last decade • 7.4% (2008) compared to 4.1% (1998) • Modest structural change (NA 2007)Slide 9 • Dynamism in service sector (48% of GDP) • Fastest growth in communication • Manufacturing growth of 8% since 2003 (9.4% of GDP 2008) • Agricultural growth 4.4% since 2000, against MKUKUTA target of 10% by 2010 (24% of GDP) • Inflation rose sharply (10.3% in 2008)
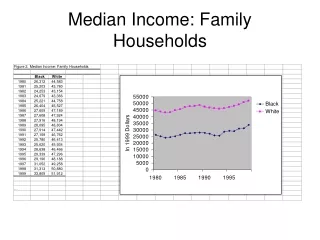
Progress towards targets (ctd) • Limited depth and diversification for domestic banks • Inadequate lending for local investments • High interest rate spread (12.5% in 2008) • No significant declines in income poverty reduction over the decade • Despite impressive macro economic outlook between 2001 and 2007 • Headcount dropped from 35.7% to 33.6%
Progress towards targets (ctd) • Consumption per capita increased by only 5% (average annual increase of 0.8%) • Very low nominal hh consumption Slide 10 • 98% less than Shs 58,000 pm • 80% less than Shs 38,000 pm, or 1,380/day • Majority still smallholder farmers • Higher headcount -38% (24% other urban, 16% Dar) • Generally insignificant change in inequality • Domestic absorption = C + G+ I Slide 11 • ΔC = -4%, ΔI = +8%, ΔG = 6%. Could these underpin long-term growth and large ΔC?
Implications for policy • Income poverty targets for MKUKUTA and MDG out of reach (needs annual real consumption per capita growth of 3.2%) Slide 12 • Redistribution of income may not be effective without high and sustained growth rate • Exploit comparative advantages and raise domestic employment and productivity • Rural hhs diversifying, but difficult for poorest hhs • Interventions to raise agricultural productivity • Incentives for smallholders to innovate • Appropriate forms of organizational and institutional arrangements
Implications for policy (ctd) • Investment in human capabilities and physical capital for sustained growth • Increased investment in roads, railways and port facilities to realize TZ comparative advantage as trade and transport hubs and unlock manufacturing potentials • Deepen the local financial sector-addressing institutional and legal deterrents for credit risks, esp. for agriculture and SMEs
Implications for Monitoring • Monitoring system need to be kept manageable-practical but sufficient for strategic planning and national reporting • Revision of indicators for growth and income poverty for more reliable evidence • Other proposed indicators • Imports and reserves • Government expenditure • Exchange rates, monetary & capital market