Download
1 / 91
930 likes | 1.2k Views
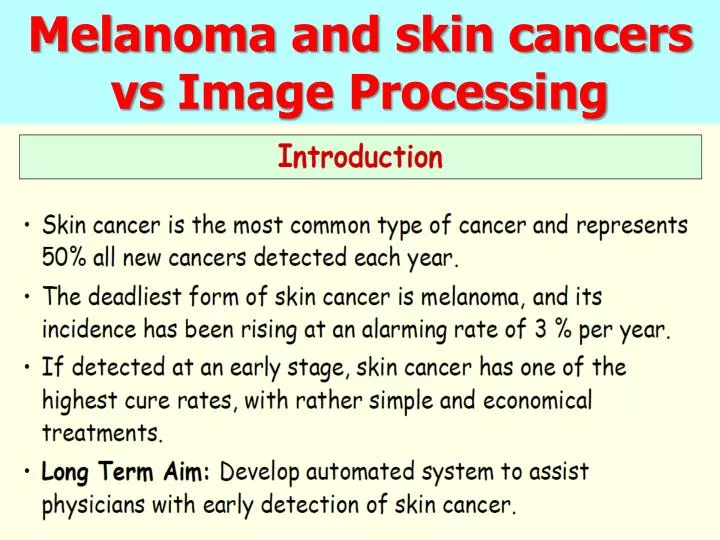
Melanoma and skin cancers vs Image Processing. Skin cancer and melanoma. Skin cancer : most common of all cancers. According to the latest statistics available from the National Cancer Institute, skin cancer is the most common of all cancers in the United states.

E N D
Skin cancer and melanoma • Skin cancer : most common of all cancers
According to the latest statistics available from the National Cancer Institute,skin cancer is the most common of all cancers in the United states. • More than 1 million cases of skin cancer are diagnosed in the US each year. • What’s shown here are some examples of skin lesion images. • The four images shown on the left are various form of skin lesions, cancerous or non-cancerous. • The two on the right are a specific form of skin cancer: melanoma.
What is Melanoma? • A type of skin cancer that starts from melanocytes • 6th leading cause of cancer death in the US • No single etiology • Some risk factors include: • Sun exposure -depleting ozone layer • Presence of many or unusual moles • Skin types • Genetics predisposition
benign skin malignant
Skin cancer and melanoma • Skin cancer : most common of all cancers [ Image courtesy of “An Atlas of Surface Microscopy of Pigmented Skin Lesions: Dermoscopy” ]
Use of color to distinguish malignant and benign tumors Skin tumors can be either malignant or benign Clinically difficult to differentiate the early stage of malignant melanoma and benign tumors due to the similarity in appearance Proper identification and classification of malignant melanoma is considered as the top priority because of cost function Classification of skin tumors using computer imaging and pattern recognition Previous texture feature algorithms successfully differentiate the deadly melanoma and benign tumor seborrhea kurtosis Relative color feature algorithm is explored in this research for differentiate melanoma and benign tumors, dysplastic nevi and nevus Successfully classify 86% of malignant melanoma using relative color features, compared to the clinical accuracy by dermatologists in detection of melanoma of approximately 75%
Types of Melanoma Superficial Spreading Melanoma 70%, neck, legs, pelvis Nodular Melanoma 15%, dome-shaped nodule Acral-Lentiginous Melanoma 8 %, Common in dark-skin LentigoMaligna Melanoma 5 %, sun-exposed area, mistaken for age spot Amelanotic Melanoma 0.3%, non-pigmented Desmoplastic 1.7%, ½ amelanotic
Automated Melanoma Recognition UsingImaging Techniques Melanoma is one of the most aggressive cancers, but it can be healed by surgical excision successfully only if it is recognized in the early stage. • Since the melanoma emerges as a tiny dot in the topmost skin layer, it can be examined during routine medical check up. • Although the lesions are accessible, in many cases, it is a difficult task to make decisions whether nevi are benign or malignant. • Further, frequent use of biopsy is also not encouraged. • Hence, to assist dermatologist's diagnosis, it is useful to develop an automated imaging-based melanoma recognition system.
Uncontrolled growth of melanocytes give rise to dark and elevated appearance of melanoma. • Neoplasm- growth of tissue, tumor • Melanoma is a type of malignant skin cancer that starts from melanocytes. It’s caused by uncontrolled growth of melanocytes that gives rise to tumor.
Nonetheless there are risks factors that highly attributed to its incidence. Some of the them are: • amount of sun exposure – the more cumulative exposure the higher • presence of many of unusual mole – people with many moles in the body • Fitzpatrick’s Skin Type I and II have higher risk –1975 Thomas Fitzpatrick, Harvard skin typing system based on skin complexion and response to sun exposure • genetic predisposition – if there history of melanoma that runs in the family • According to a study ,compared to general population, people who with 2 risk factors have 3.5 times risk of developing MM and 20 times those who have 3 or more risk factors.
These are the types of melanona • As you see, SSM is the most prevalent one that makes up 70% of most diagnosed melanoma • In this work, images of superficial spreading melanoma were only explored. • The reason being, and the problem that this work is trying to solve, Dysplastic Nevi ( a benign mole) has properties that are highly similar to this SSM melanoma, which makes the diagnosis of melanoma difficult.
Melanoma Incidence NCHS – national center for health statistics Bureau of Health Statistics Incidence highest in Caucasian skin Graph one- Caucasian has the highest incidence of MM. Having fair complexion is one of the risk factors. Researches attribute this to low level of melanin that absorbs harmful UV radiation in fair skin, thus UV penetrates much deeper layer affects the surrounding cells.
Graph two – men shows higher incidence than women. • A study of in Germany linked this trend to mutation of genes called BRAF 4% and CDKN2A 1%.
Melanoma Incidence Graph thee – Incidence increases with age. Link to cumulative sun exposure Some studies suggested that people who had significant exposure to UV at younger age have higher risk in later age when UV exposure decreases. Incidence increases with age
Age-adjusted- distribution of age by percentage • It’s a way of data normalization so that you can compare two different countries, cities and so forth • Need standard population distribution • Who use it • NCHS – national center for health statistics • Bureau of Health Statistics • What to say • So these are three graphs that show melanoma incidence in different dimensions: based on race, gender, and age. • Here, it’s evident that Melanoma has its favorites, so to speak.
Melanoma Incidence It is estimated that 62,480 men and women (34,950 men and 27,530 women) will be diagnosed with and 8,420 men and women will die of melanoma of the skin in 2008 (SEER)
Surveillance Epidemiology and End Results • What to say • This is the combination of all of the data from the previous slides. • Average of 4.2 percent increase per year
Survival Rate by Stage The American Joint Committee on Cancer (AJCC) TNM System http://www.cancer.org
The imaging is performed by a special CCD camera combined with an epiluminescence microscope in order to produce digitalized ELM images of the skin lesions. • Once the images are captured, the lesion has to be segmented from the background and useful information should be extracted from the lesion region. • Based on the extracted features, decisions have to be made about the nature of the skin lesion. • The decisions should be supported by descriptive justifications so that dermatologist can understand the decision making process.
Contact person: Assoc. Prof. PonnuthuraiNagaratnamSuganthan, email: epnsugan@ntu.edu.sgTel: 6790-5404 • Collaborators: Prof. C L Goh, MD, National Skin Centre, Singapore & Dr. H Kittler, University of Vienna • This is an on-going project. We have implemented the segmentation, feature extraction and clasifcation modules satisfactorily, although further improvements are desirable. The module to provide explanations supporting the classifcation decisons is yet to be developed. siii
Skin cancer and melanoma • Skin cancer : most common of all cancers • Melanoma : leading cause of mortality (75%) Although represent only 4 percent of all skin cancers in the US, melanoma is the leading cause of mortality. They account for more than 75 percent of all skin cancer deaths. [ Image courtesy of “An Atlas of Surface Microscopy of Pigmented Skin Lesions: Dermoscopy” ]
The time line shown here is the 10 year survival rate of melanoma. If caught in its early stage, as seen here, melanoma can often be cured with a simple excision, so the patient have a high chance to recover. Hence, early detection of malignant melanoma significantly reduces mortality. Skin cancer and melanoma • Skin cancer : most common of all cancers • Melanoma : leading cause of mortality (75%) • Early detection significantly reduces mortality [ Image courtesy of “An Atlas of Surface Microscopy of Pigmented Skin Lesions: Dermoscopy” ]
Clinical View Dermoscopy view [ Image courtesy of “An Atlas of Surface Microscopy of Pigmented Skin Lesions: Dermoscopy” ]
Dermoscopy • Dermoscopy is a noninvasive imaging technique, and it is just the right technique for this task. • It has been shown effective for early detection of melanoma. • The procedure involves using an incident light magnification system, i.e. a dermatoscope, to examine skin lesions. • Often oil is applied at the skin-microscope interface. • This allows the incident light to penetrate the top layer of the skin tissue and reveal the pigmented structures beyond what would be visible by naked eyes.
Dermoscopy view Clinical view Dermoscopy • Dermoscopy improves diagnostic accuracy by 30% in the hands of trained physicians • May require as much as 5 year experience to have the necessary training • Motivation for Computer-aided diagnosis (CAD) of pigmented skin lesion from these dermoscopy images.
In the future, with the development of new algorithms and techniques, these computer procedures may aid the dermatologists to bring medical break through in early detection of melanoma.
40,000 people between 1988-2001 • Cancer stage is categorized into TNM level • T – tumor ( localized) • N – regional lymph-nodes • M -Metastasis • The key point is the earlier the better of survival • 5- and 10- year survival mean percentage of people who live at least 5 and 10 years respectively after being diagnosed
E= evolution/elevation What to say ABCDE system is the tool for detecting melanoma. This is a list of criteria that can be used for distinguishing between benign and malignant melanocytic skin lesions. A- if you draw a line across the center of MM, you’ll see that is not symmetric compared to regular mole B- the border is uneven or ragged is a sign of melanoma C-if there are multiple shades of pigment is presence D- diameter > 6mm Dermatologist adds E for either evolution if lesion changes upon observation or E for elevation. Suspicious lesion is followed by histological confirmation.
Where the problems lie • Atypical nevi acquire several properties similar to melanoma, their recognition posed high difficulties even to experts. The classical ABCD guidance is not reliable therefore cannot be used as sole indicator for detection of melanoma for both clinical and public examination. • In clinical setting, recognition and discrimination are highly subjective with rate of success based on experts’ years of experience. As was found, inexperienced dermatologists showed decrease sensitivity in the detection of melanoma in both live and photo examinations. • General practitioner – 62% sensitivity and 63% specificity • Dermatologist – 80% sensitivity and 60% specificity
OK, so we have the ABCD diagnosis tool plus the experts. • So anyone with sort of skin lesion can step in a clinic get the ABCD tool and experts examination undertaken then there you have the results. • You either have benign mole or malignant melanoma at the end of the consultation. Everything just goes as plan. • Unfortunately it is not always the case. • Sensitivity – TP/TP+FN • Specificity – TN/TN+FP • Read the bullet • The objective of the this work is to address these problems
Here you have some samples of MM on the top row and DN on the bottom row Atypical Nevi (mole) – shares some sometimes all characteristics of MM. This actually what makes melanoma detection difficult. MM and DN ABCD Rules Malignant Melanoma Dysplastic Nevi
Objectives To construct an automated, image-based system for classification of Malignant Melanoma and Dysplastic Nevi using solely the visual texture information of the lesion. The system will be based on methodologies that emanate and/or correlated with human vision therefore will closely emulates human experts only with greater extent of accuracy, reliability and reproducibility • Investigate new segmentation methods that will be effective on both lesions • Extract most relevant texture information from the image • Construct a classification system of the lesion
Ultimate goal is the construction of the classification system • The uniqueness of the system is the fact that : • only texture information is used – robust in color variability • Methodologies used through out the whole process emanate from the human vision thus emulate human expert
Systems, Materials and Tools • Image database • Original tumor images • 512x512 24-bit color images digitized from 35mm color photographic slides and photographs • 160 melanoma, 42 dysplastic, and 80 nevus skin tumor images • Border images • Binary images drawn manually and reviewed by the dermatologist for accuracy • Software • CVIPtools • Computer vision and image processing tools developed at our research lab • Partek • Statistical analysis tools
Outline of the Process Here you have the outline of the process Each of the subsequent step is dependent of the of the preceding steps. In other terms, the results of subsequent step is only as good as the results of preceding steps. Therefore, since segmentation is the top most of the hierarchy, its important to make sure the method is robust.
Hypotheses • Due to observable pattern disruption in the skin tissue driven by the MM, It is hypothesize that measuring magnitude of pattern disruption provides discriminative features for diagnosing MM. • Since visual texture is highly length-scale dependent, It is hypothesized that the detection and analysis methods that explore texture at different scales such as the wavelet is the most appropriate approach. • It is hypothesized that texture descriptors that emanate from and highly correlated with human vision system provide the utmost representation, and thus yield a more contextual system—a system that closely emulate human expert
Item one – skin has distinct uniform pattern (glyphic pattern). • MM disrupts texture. • Quantifying texture differences between MM and NV is more reliable method than color-based ( color-based in prone to variability in imaging system) • Item two – texture come in different sizes. • Detection method that explore texture image at different possible scale is more sensitive than methods that are using one scale. • Example of this snake-based ( gradient-based), Normalized Cut, histogram threshold
Item three – there are many texture descriptors that are purely algorithmic that may not necessary correlate with human vision. • One example is first-order statistics of texture ( variance ,mean), structure-based approach, laplacain of Gaussian. • Texture classifiers that emanate from or highly correlated with human visual system provides a closer approximation of experts perception of texture.
Texture Technical Definition • Texture is regarded as what constitutes a macroscopic region. Its structure is simply attributed to the repetitive patterns in which elements or primitives are arranged according to a placement rule(Tamura et al, 1978). • Texture is both the number and types of its (tonal) primitive and their spatial arrangement (Haralick ,1979). • The term texture generally refers to repetition of basic texture elements called texels. The texel contains several pixels, whose placement could be periodic, quasi-periodic, or random. Natural textures are generally random, whereas artificial textures are often deterministic or periodic. Texture may be course, fine, smooth, granulated, rippled, regular, irregular, or linear (Jain, 1989). • Texture is intuitively viewed as descriptor in providing a measure of properties such as smoothness, coarseness, and regularity (Gonzales and Woods, 1990). • Texture is an attribute representing the spatial arrangement of the gray levels of the pixels in a region (IEEE, 1990). • Texture is both grey level of a single pixel and its surrounding pixels, which was coined as a unit texture, texels. These texels conformed repetitive patterns that dictated the effective texture analysis approach (Karu et al, 1996). • Patterns which characterize objects are called texture in image processing (Jähne, 2005).
Texture has no single definition. • Definitions from previous literature dedicated in studying texture • The first three definitions, tells us texture is composed of a building block that is spatially arranged based on the placement rule (periodic, quasi periodic, or random): like a brick a single brick is the building block, the arrangement of the bricks that gives rise to a texture of a brick wall • Texture is descriptors for smoothness, coarseness, and regularity • In computer vision • Spatial arrangement of gray levels of the pixel • Pattern
Texture and Human Vision System Pre-attentive visual system-1962-1981 • Dr. Julesz • Neuroscientist • Texture perception • Statistical approach • Disproved conjecture that second-order is processed in the vision system • Textons • Contrast • Terminator-end of lines, corners • Elongated blobs of different sizes - granularity