Download
1 / 24
240 likes | 245 Views
This presentation discusses the allocation of CO2 emission allowances in RGGI, analyzing the cost, distributional consequences, and other considerations. It explores three bookend approaches to allocation and their impact on electricity prices, emissions, and social costs. The presentation also examines the economic efficiency, distributional effects, and other considerations of these approaches.

E N D
Allocation of CO2 Emission Allowances in RGGI Dallas Burtraw, Karen Palmer, Danny Kahn Resources for the Future Presentation to RGGI Stakeholder MeetingApril 6, 2005Thanks to: The Energy Foundation, The Packard Foundation and New York Community Trust
Project Goals • Measure cost of various approaches to initial distribution of allowances. We do not consider costs outside the electricity sector. • Describe distributional consequences between consumers and producers, and among producers. • Identify ancillary effects and other considerations.
Sources Sources Sources Sources Initial Distribution of Allowances Apportionment RGGI Emissions Cap States Allocation RFF analysis assumes uniform approach to allocation used by states.
Three Bookend Approaches to Allocation • Title IV SO2 • Some states for NOx • Dutch NOx trading • Some states for NOx • Spectrum • VA for NOx • Lead phase-out • Some states for NOx • Sweden NOx tax • Some states for NOx • Common formula across fuels, sources?
Scenarios Policy: Start at 2008 baseline CO2 emissions and phase down by 20% by 2025 in nine state region. Three bookend approaches to allocation: • Auction: Revenues have value in analysis. • Historic Generation: Allocation to all incumbent emitters based on 1999 shares of generation. • Updating: Allocation to emitters based on generation from 2 years previous. About a dozen derivative approaches and combinations are also explored.
General Conclusions First… • Due to electricity deregulation, Auction and Historic approaches yield the same electricity price, and the same social cost. We do not look at costs outside electricity sector (doing so would favor an Auction). • Updating yields a slightly lower electricity price and more generation in the region, but at a higher social cost. Updating yields lower emissions of SO2, NOx, mercuryin region. • Allowance value is at least four times the social cost. • The initial distribution of allowances determines which producers and consumers bear the cost of the program.
1) Economic Efficiency • Generally, the Auction and Historic approaches are similar because of competitive pricing in northeast electricity markets. • The Auction and Historic approaches are more efficient than the Updating approach. • Substantial variety exists among Updating approaches, with some approaches also relatively efficient.
TOTAL Revenues Producers Consumers A Look at the Economic Efficiency of the Bookends Approaches, 2025 NegativeSurplus = Cost
Additional Cases • Transmission Constraints • High Natural Gas Prices • Renewable Policies • None of these potential outcomes increase the cost of RGGI relative to the respective baselines. • Tighter gas or transmission constraints benefit producers in the aggregate. These constraints have a greater impact on electricity price than does the RGGI program. • Mixed Cases • Combining approaches generally leads to intermediate results.
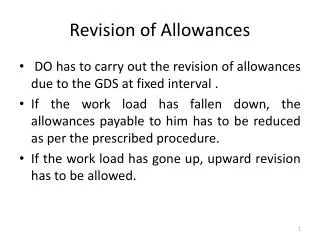
2) Allowances as Compensation Compensation is justification for free distribution.How much compensation is sufficient? • Firms charge consumers for using emission allowances, whether the allowances were received for free or at a cost. • Fixed price contracts mitigate the ability to pass through costs in the short run. • Are other segments of the economy/society also candidates for compensation?
Avg. All Nuclear Coal Gas A Look at the Distributional Effects of the Bookends for Existing (1999) Assets Existing coal is much better off under historic allocation
Shareholder Value for Three Firms:Effects on Assets in RGGI Region Capacity Mix Nuclear & Renewable Coal Gas & Oil
Shareholder Value for Firm D:Effects on Assets in and out of RGGI Region Capacity Mix Nuclear & Renewable Coal Gas & Oil
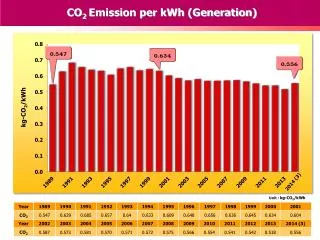
3) Other considerations… Conventional Pollutants • Expected emission reductions in the region are accelerated under RGGI policy. In the region emissions fall by roughly 40-45% under Auction and Historic approaches, and by 65-81% under Updating. • Capping CO2 emissions has the effect of lowering compliance cost for conventional pollutants (NOx, SO2, Hg) within RGGI. • Nearly $200 million in savings under Auction and Historic by 2025. • Over $400 million in savings for Updating by 2025.
Closing Observations • Auction, Historic are mostefficient but Updating leads to lower electricity prices. • Change in shareholdervalue depends on the portfolio of assets. A firm may have facilities that lose and that gain value, inside and outside of the region. • Cost of the RGGI policy is not sensitive to natural gas or transmission constraints. Tighter constraints benefit producers in the aggregate in the baseline. These constraints have a greater impact on electricity price than does the RGGI program. • Combining approaches generally leads to intermediate results. • We suggest the emphasis given to compensation versus efficiency can differ between the short run and long run for RGGI planners.
For More Information www.rff.org/multipollutant
Experiments • Simulation model: Highly parameterized national model of electricity sector. • Regulation: Limited restructuring. • Scenario: Start at 2008 baseline emissions and phase down by 20% by 2025. • RGGI: Nine state region with MAAC power region split. All new emitting plants in MAAC located outside of RGGI with new renewable plants inside RGGI.
Updating allocation benefits a new gas plant compared to an existing coal plant
What is meant by Efficiency? • There are several measures of efficiency • Engineering measures. • Technical (static) economic efficiency – equalize marginal cost at facilities will minimize resource costs. This is the usual measure of success of trading programs but it is not a complete measure of efficiency. • Dynamic efficiency – technological change. • Most important measure is social cost within formal benefit-cost analysis – changes in economic surplus. • In the short run efficiency may be less important than feasibility. In the long run efficiency is crucial if society moves towards more substantial carbon reduction goals.
RGGI Surplus Comparison Scenarios defined in Table 1 of paper.
Change in Asset Value Scenarios defined in Table 1 of paper.
Limitations in Bookend Analysis • Electricity imports from Canada do not change. • Out-of-merit-order dispatch due to long-term fuel contracts is captured only approximately. We do not capture long-term contracts for nuclear. • Intra-regional transmission constraints are captured only partly. • We examine higher natural gas prices, renewable policies, imports from Canada and transmission constraints in sensitivity analysis.