Download
1 / 54
540 likes | 720 Views
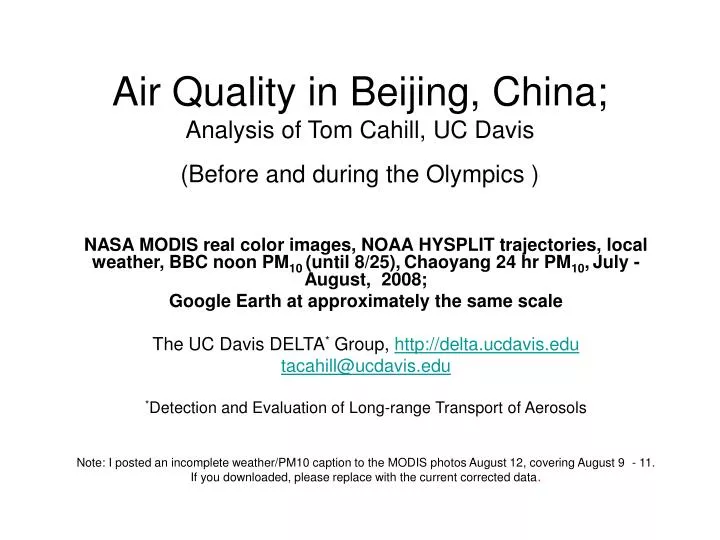
Air Quality in Beijing, China; Analysis of Tom Cahill, UC Davis (Before and during the Olympics ). NASA MODIS real color images, NOAA HYSPLIT trajectories, local weather, BBC noon PM 10 (until 8/25), Chaoyang 24 hr PM 10 , July - August, 2008; Google Earth at approximately the same scale

E N D
Air Quality in Beijing, China;Analysis of Tom Cahill, UC Davis(Before and during the Olympics ) NASA MODIS real color images, NOAA HYSPLIT trajectories, local weather, BBC noon PM10 (until 8/25),Chaoyang 24 hr PM10,July - August, 2008; Google Earth at approximately the same scale The UC Davis DELTA* Group, http://delta.ucdavis.edu tacahill@ucdavis.edu *Detection and Evaluation of Long-range Transport of Aerosols Note: I posted an incomplete weather/PM10 caption to the MODIS photos August 12, covering August 9 - 11. If you downloaded, please replace with the current corrected data.
Coal deposits in China, sites of most of the coal fired power plants Beijing
Summary: July, 2008;in about ½ of all days, winds were from south of Beijing with the highest pollution level; average = 202.2 g/m3 (max =351 g/m3) • Trajectories from Mongolia, relatively high wind velocities – avg 23.0 g/m3 4 days • Mongolia plus slow SW loop – 69.0 g/m3 1 day • Trajectories south of Beijing, relatively low wind velocities – avg 202.2 g/m3 12 days • Trajectories south and east of Beijing, relatively low wind velocities – avg 96.7 g/m3 4 days • Trajectory SW of Beijing – 105.0 g/m3 1 day • Trajectory NE of Beijing – fast wind velocities 32.0 g/m3 1 day
Pre-controls 124.2 ug/m3 Post-controls 129.3 ug/m3 Olympics 78.4 g/m3 Institution of Chinese controls UN WHO interim goal for developing countries WHO goal
PM10 – BBC noon versus Chaoyang (stadium) 24 hr Since my goal is to explain daytime visibility, I choose the BBC noon readings, usually at minimum RH, so as to avoid nighttime fogs and accelerated particle removal. These ended on August 26. The Chaoyang readings at the stadium are 24 hr. Other readings throughout Beijing are similar to Chaoyang, at the stadium, affirming the regional nature of the haze sulfates (see analysis at end). This also predicts that most of the mass is actually PM2.5, and because these particles are inhalable, subject to a more strict with a US EPA 24 hour value at 35g/m3.
August 8, 2008; T avg =29.7 C, RH avg = 72%, rain = 0.0 cm, Vw = 8.3 km/hr, Visibility = 3.6 km, PM10 = 156 g/m3 Beijing
On Friday, trajectories arrived to Beijing from the south, a highly polluted sector, and at low wind velocities. Trajectories from the NOAA HYSPLIT model trace where the air arriving in Beijing midday August 8 came from for the past 48 hours. The height of the trajectories are red 200, blue 500, and 1000 m
August 9, 2008; T avg =29.7 C, RH avg = 75%, rain = 0.0 cm, Vw = 8.0 km/hr, Visibility = 4.2 km, PM10 = 110 g/m3 Beijing
On Saturday, trajectories arrived to Beijing from the south, a highly polluted sector, and at low wind velocities. Trajectories from the NOAA HYSPLIT model trace where the air arriving in Beijing midday August 9 came from for the past 48 hours for trajectories heights of 200, 500, and 1000 m above the ground
August 10, 2008; T avg =25.9 C, RH avg = 88%, rain = 2.1 cm, Vw = 9.6 km/hr, Visibility = 3.4 km, PM10 = 278 g/m3 Beijing
On Sunday trajectories arrived to Beijing from the southeast, a highly polluted sector, and at low wind velocities. Trajectories from the NOAA HYSPLIT model trace where the air arriving in Beijing midday came from for the past 48 hours for trajectories heights of 200, 500, and 1000 m above the ground
August 11, 2008; T avg =23.1 C, RH avg = 88%, rain = 2.7 cm, Vw = 8.0. km/hr, Visibility = 9.6 km, PM10 = 54 g/m3 Beijing
On Monday, trajectories arrived to Beijing from the east, an oceanic sector with heavy rain Trajectories from the NOAA HYSPLIT model trace where the air arriving in Beijing midday came from for the past 48 hours for trajectories heights of 200, 500, and 1000 m above the ground
August 12, 2008; T avg =25.3 C, RH avg = 81%, rain = 1.6 cm, Vw = 6.4. km/hr, Visibility = 11.0 km, PM10 = 41 g/m3 Beijing
On Tuesday, trajectories arrived to Beijing from the east, an oceanic sector with continuing rain Trajectories from the NOAA HYSPLIT model trace where the air arriving in Beijing midday August 12 came from for the past 48 hours. The height of the trajectories shown in the lower panel are red 200, blue 500, and 1000 m
August 13, 2008; T avg =26.4 C, RH avg = 82%, rain = 0.0 cm, Vw = 3.2. km/hr, Visibility = 5.1 km, PM10 = 128 g/m3 Beijing
On Wednesday trajectories arrived to Beijing from the southeast, with some oceanic influence, and at low wind velocities. Trajectories from the NOAA HYSPLIT model trace where the air arriving in Beijing midday August 13 came from for the past 48 hours. The height of the trajectories are red 200, blue 500, and green 1000 m AGL
August 14, 2008; T avg =24.2 C, RH avg = 87%, rain = 1.7 cm, Vw = 8.0. km/hr, Visibility = 7.5 km, PM10 = 46 g/m3 Beijing
On Thursday trajectories arrived to Beijing from the east, with some oceanic influence, and at low wind velocities. Trajectories from the NOAA HYSPLIT model trace where the air arriving in Beijing midday August 14 came from for the past 48 hours. The height of the trajectories are red 200, blue 500, and green 1000 m AGL
August 15, 2008; T avg =25.6 C, RH avg = 64%, rain = 0.5 cm, Vw = 8.0. km/hr, Visibility = 17.3 km, PM10 = 12 g/m3 Beijing
On Friday trajectories arrived to Beijing from the northeast, with moderate wind velocities. Trajectories from the NOAA HYSPLIT model trace where the air arriving in Beijing midday August 15 came from for the past 48 hours. The height of the trajectories are red 200, blue 500, and green 1000 m AGL
August 16, 2008; T avg =23.7 C, RH avg = 61%, rain = 0.0 cm, Vw = 8.0. km/hr, Visibility = 29.1 km, PM10 = 7 g/m3 Beijing
On Saturday trajectories arrived to Beijing from the northeast, a clean sector, with high wind velocities. Technical note: Trajectories from the NOAA HYSPLIT model trace where the air arriving in Beijing midday August 16 came from for the past 48 hours. The height of the trajectories are red 200, blue 500, and green 1000 m AGL
August 17, 2008; T avg =21.5 C, RH avg = 84%, rain = 0.0 cm, Vw = 4.8. km/hr, Visibility = 12.3 km, PM10 = 54 g/m3 Beijing
On Sunday trajectories arrived to Beijing from the northeast, a clean sector, at moderate wind velocities. Technical note: Trajectories from the NOAA HYSPLIT model trace where the air arriving in Beijing midday August 17 came from for the past 48 hours. The height of the trajectories are red 200, blue 500, and green 1000 m AGL
August 18, 2008; T avg =23.1 C, RH avg = 73%, rain = 0.0 cm, Vw = 8.0, km/hr, Visibility = 22.4 km, PM10 = 18 g/m3 Beijing
On Monday trajectories arrived to Beijing from the east, a clean sector, with oceanic influence, and at moderate wind velocities. Technical note: Trajectories from the NOAA HYSPLIT model trace where the air arriving in Beijing midday August 18 came from for the past 48 hours. The height of the trajectories are red 200, blue 500, and green 1000 m AGL
August 19, 2008; T avg =29.7 C, RH avg = 75%, rain = 0.0 cm, Vw = 4.8, km/hr, Visibility = 13.6 km, PM10 = 39 g/m3 Beijing
On Tuesday winds arrived at Beijing from the northeast, with a local gyre and low wind velocities. Technical note: Trajectories from the NOAA HYSPLIT model trace where the air arriving in Beijing midday August 19 came from for the past 48 hours. The height of the trajectories are red 200, blue 500, and green 1000 m AGL
August 20, 2008; T avg =25.3 C, RH avg = 75%, rain = 0.0 cm, Vw = 4.8, km/hr, Visibility = 8.8 km, PM10 = 39 g/m3 Beijing
On Wednesday winds arrived to Beijing from the south and southeast, a polluted sector, with a local gyre and low wind velocities. PM10 values are rising and visibility decreasing. Technical note: Trajectories from the NOAA HYSPLIT model trace where the air arriving in Beijing midday August 20 came from for the past 48 hours. The height of the trajectories are red 200, blue 500, and green 1000 m AGL
August 21, 2008; T avg =20.9 C, RH avg = 92%, rain = 0.4 cm, Vw = 8.0, km/hr, Visibility = 5.8 km, PM10 = 56 g/m3 Beijing
On Thursday winds arrived to Beijing from the southeast, a moderately polluted sector with oceanic influences, with wind velocities. PM10 values are rising. Technical note: Trajectories from the NOAA HYSPLIT model trace where the air arriving in Beijing midday August 20 came from for the past 48 hours. The height of the trajectories are red 200, blue 500, and green 1000 m AGL
August 22, 2008; T avg =25.3 C, RH avg = 72%, rain = 0.0 cm, Vw = 6.4, km/hr, Visibility = 7.8 km, PM10 = 21 g/m3 Beijing
On Friday winds arrived to Beijing from the northwest, the cleanest sector, with moderately high wind velocities. PM10 values are low and visibility excellent. Technical note: Trajectories from the NOAA HYSPLIT model trace where the air arriving in Beijing midday August 20 came from for the past 48 hours. The height of the trajectories are red 200, blue 500, and green 1000 m AGL
August 23, 2008; T avg =26.4 C, RH avg = 69%, rain = 0.0 cm, Vw = 4.8, km/hr, Visibility = 15.4 km, PM10 = 12 g/m3 Beijing
On Saturday, winds arrived to Beijing from the west-northwest, the cleanest sector, with moderately high wind velocities. PM10 values are low and visibility excellent. Technical note: Trajectories from the NOAA HYSPLIT model trace where the air arriving in Beijing midday August 20 came from for the past 48 hours. The height of the trajectories are red 200, blue 500, and green 1000 m AGL
August 24, 2008; T avg =26.4 C, RH avg = 62%, rain = 0.0 cm, Vw = 9.6, km/hr, Visibility = 12.8 km, PM10 = 99 g/m3 Beijing
On Sunday winds arrived to Beijing from the west, a moderately polluted sector, with average wind velocities. PM10 values are rising and visibility excellent. Technical note: Trajectories from the NOAA HYSPLIT model trace where the air arriving in Beijing midday August 20 came from for the past 48 hours. The height of the trajectories are red 200, blue 500, and green 1000 m AGL
August 25, 2008; T avg =24.8 C, RH avg = 74%, rain = 0.0 cm, Vw = 6.3, km/hr, Visibility = 8.6 km,PM10 = 70 g/m3 Beijing
On Monday, the first day after the Olympics, winds arrived to Beijing from the south, a highly polluted sector, with average wind velocities. PM10 values are rising and visibility degrading. Technical note: Trajectories from the NOAA HYSPLIT model trace where the air arriving in Beijing midday August 20 came from for the past 48 hours. The height of the trajectories are red 200, blue 500, and green 1000 m AGL
August 26, 2008; T avg =23.9 C, RH avg = 79%, rain = 0.0 cm, Vw = 8.0, km/hr, Visibility = 6.6 km,PM10 = 93 g/m3 Beijing
On Tuesday, after the Olympics, winds arrived to Beijing from the southeast, a moderately polluted sector, with average wind velocities. PM10 values are high and visibility degrading. Technical note: Trajectories from the NOAA HYSPLIT model trace where the air arriving in Beijing midday August 20 came from for the past 48 hours. The height of the trajectories are red 200, blue 500, and green 1000 m AGL
August 27, 2008; T avg =23.1 C, RH avg = 79%, rain = 0.0 cm, Vw = 4.8, km/hr, Visibility = 6.1 km,PM10 = 55 g/m3 PRC Beijing
On Wednesday, after the Olympics, winds arrived to Beijing from the southeast, a moderately polluted sector, with average wind velocities. PM10 values are moderate and visibility degrading. Technical note: Trajectories from the NOAA HYSPLIT model trace where the air arriving in Beijing midday August 20 came from for the past 48 hours. The height of the trajectories are red 200, blue 500, and green 1000 m AGL
August 28, 2008; T avg =24.8 C, RH avg = 79%, rain = 0.0 cm, Vw = 4.8, km/hr, Visibility = 4.5 km,PM10 = na g/m3 PRC Beijing
On Thursdasy, after the Olympics, winds arrived to Beijing from the southeast, a polluted sector, with low wind velocities. PM10 values are high and visibility degrading. Technical note: Trajectories from the NOAA HYSPLIT model trace where the air arriving in Beijing midday August 20 came from for the past 48 hours. The height of the trajectories are red 200, blue 500, and green 1000 m AGL
August 29, 2008; T avg =23.7 C, RH avg = 88%, rain = 0.9 cm, Vw = 6.4, km/hr, Visibility = 3.5 km, PM10 = 122 g/m3 PRC Beijing
On Friday, after the Olympics, winds arrived to Beijing from the south, a polluted sector, with low wind velocities. PM10 values are very high and visibility degraded. Technical note: Trajectories from the NOAA HYSPLIT model trace where the air arriving in Beijing midday August 20 came from for the past 48 hours. The height of the trajectories are red 200, blue 500, and green 1000 m AGL