Download
1 / 32
320 likes | 415 Views
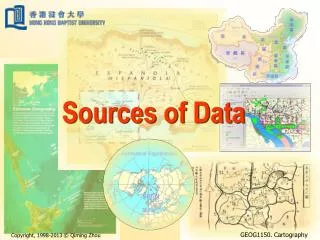
Overview of AQ data sources in ambient conditions mapping context. Chris McLinden and Robert Vet Contributors: Yves Rochon, Mike Moran, Ray Nassar, Randall Martin, David Anselmo, and others from AQRD, CRD, & CMC 16 January 2012. Introduction. Platforms: Ground-based (stationary and mobile)

E N D
Overview of AQ data sources in ambient conditions mapping context Chris McLinden and Robert Vet Contributors: Yves Rochon, Mike Moran, Ray Nassar, Randall Martin, David Anselmo, and others from AQRD, CRD, & CMC 16 January 2012
Introduction • Platforms: • Ground-based (stationary and mobile) • In-situ or point measurements • Remote sensing from below • Aircraft and balloon • In-situ (mostly) and remote sensing • Satellite – remote sensing from above
Introduction • Overview of some sources and databases • North American air and precip surface data • Some ground-based remote sensing networks • WOUDC (ground-based and ozonesondes) • Greenhouse Gases (sources other than satellites) • Emission measurements • Satellites
Sources of North American Air and Precipitation Data (ground-based in-situ and point measurements) • Canadian Data • National Atmospheric Chemistry (NAtChem) Database and Analysis Facility (www.ec.gc.ca/natchem/) • Air and precipitation chemistry data from major regional-scale networks in North America in standard format and web accessible • Canada-Wide Air Quality System (CWAQS) Database • U.S. Data available from the US EPA • Air Quality System (AQS) • CMC archiving of surface AQ observation data (NRT)
National Atmospheric Chemistry Database and Analysis Facility (NAtChem) • Data • Precipitation Chemistry • CAPMoN, Provincial, Mercury Deposition Network (Canada) • U.S. NADP (archived but not downloadable) • Air Quality • Canadian Air and Precipitation Monitoring Network (acidifying PM and gases) • Total Gaseous Mercury and Mercury Speciation (soon) • Canadian Arctic Aerosol Chemistry Program (aerosol speciation) • Canadian Arctic Northern Contaminants Program (hazardous air pollutants) • Integrated Atmospheric Deposition Network (toxics) • Canadian Baseline Measurement Program (greenhouse gases) • Canadian Aerosol Baseline Measurements (Arctic aerosol composition, number, scattering and absorption) • Historical networks and special studies including Pacific 2001, CARE NMHCs, Nitrogen Scoping Study
Canada-Wide Air Quality System Database for NAPS Data • Under development for the federal-provincial National Air Pollution Surveillance Network (NAPS) • Largely urban air quality data • Criteria Air Contaminants: SO2, NO/NOx, CO, PM2.5 and O3 • Volatile Organic Compounds (VOCs) • Polycyclic Aromatic Compounds (PACs) • Turn-on date unknown • NAPS data can currently be obtained by contacting Jean-Pierre Charland of AAQS
United States Air Quality System (AQS)for U.S. Data • All U.S. network air quality data • http://www.epa.gov/ttn/airs/airsaqs/ (Air Quality System) • Available data: • State compliance monitoring data • Special Network data • IMPROVE (PM speciation, visibility) • CASTNET (PM and gas speciation, ozone) • For other content of EPA Technology Transfer Network (e.g. emission inventories) see • http://www.epa.gov/ttn/
Example: 2006 AQ Data Availability • North American data compiled for the 2006 AURAMS evaluation and the Air Quality Model Evaluation International Initiative (AQMII) • Slides provided by Mike Moran and data compiled by Qiong Zheng • Data integration is time consuming and requires a knowledge of measurement methods
Courtesy of D. Anselmo and A. Robichaud CMC archiving of surface obs data • Since 2007 under AIRNow (with some data prior) • Clients/users • AQHI national forecast program (Canadian data) • UMOS (Canadian data) • Model verification (Canadian and US data) • Objective analysis system for surface pollutants (Can. and US) • Canadian sources • Metro Vancouver (DRDAS) BC MoE (DRDAS) • Alberta Env (9 air sheds, CASA server) Ontario MoE (DRDAS) • Saskatchewan Env (DRDAS) CAPMoN • Manitoba Conservation (moving to DRDAS) • Ville de Montréal & Québec MDDEP (via Québec Region) • New Brunswick, PEI, Nova Scotia, Newfoundland (via Atlantic Region)
Courtesy of D. Anselmo and A. Robichaud CMC archiving of surface obs data • Canadian sources • Format: AIRNow ‘OBS’ ASCII • Species: O3, PM2.5, PM10, NO2, SO2, H2S, TRS, CO, NO Stns: 175, 165, 35, 135, 70, 5, 20, 30, 75 • Hourly observations processed in NRT at 40 mins past hour • US sources • From AIRNow Gateway:www.airnowgateway.org • Format: ‘AQCSV’ ASCII (improvement over ‘OBS’) • Species: Primarily O3 and PM2.5 • Includes other pollutants and meteorology for select stations • Availability in NRT: ~80% after 1 hour; ~95% after 2 hour • Also archived/acquired: Canadian Brewer UV and total column ozone, MODIS (2007+) and GOME-2 (2010+) satellite data
Ground-based remote sensing - Aeronet • A global sunphotometer network providing aerosol optical depth at several wavelengths between 340 and 1640 nm (Aerocan is Canadian network, 19 sites, part of Aeronet) • Data record 1993-present at http://aeronet.gsfc.nasa.gov/ (http://www.aerocanonline.com/templates/nature/index.html) • Data synergy tools available online CIMEL sunphotometer In Arctic Aeronet Stations
Ground-based remote sensing - Other • CoralNET (Canadian Operational Research Aerosol Lidar Network): • EC Lidar network, late 2000s to 2011 (contact K. Strawbridge) • measures the aerosol backscatter coefficient (optical parameter) at two wavelengths (1064nm and 532nm) • near ground to 15 km (3 m vertical resolution), every 10 s • FTIR (Fourier Transform Infrared spectrometer): • provides total and/or partial column of species such as NO, NO2, O3, CO, CO2, N2O, CH4, HNO3, others… • EC has data from Eureka and CARE (Egbert) • Multiple international FTIR networks, including NDACC (Network for the Detection of Atmospheric Composition Change), http://www.ndsc.ncep.noaa.gov/
WOUDC • World Ozone and Ultraviolet Data Centre • Database containing long-term, global Dobson and Brewer total ozone column and ozonesonde data • http://www.woudc.org/index_e.html • Maintained by EC • Link to EC ozonesonde based climatologies • Link to historical and NRT total column ozone maps constructed for multiple sources Ozonesonde Locations
Greenhouse Gas Data • Data sources analogous to air quality gases: surface networks (in-situ and remote), aircraft, satellite • NOAA oversees global network of surface stations (flasks, towers, …) and hosts data centre (http://www.esrl.noaa.gov/gmd/ccgg/) including CarbonTracker and GLOBALVIEW products • Other providers: EC, CSIRO, JMA, Universities, Euro organizations • TCCON – Total Column Carbon Observing Network: Network of FTIRs focusing on CO2 and CH4www.tccon.caltech.edu NOAA ESRL Cooperative Measurement Programs
Courtesy of M. Moran Emissions measurements Were reviewed in 2005 NARSTO Assessment “Improving Emission Inventories for Effective Air Quality Management Across North America” They are: • Uncommon • Difficult to make
Courtesy of M. Moran Emission measurement techniques • Direct • Eddy correlation flux measurements • Continuous Emissions Monitoring Systems (CEMS) • Portable emissions measurement systems • Dilution tunnel sampling • Mobile laboratories as chase vehicles • Indirect • Roadway tunnel studies • Remote sensing (e.g., NDIR, FTIR, DOAS, ...) • Mobile laboratories for vehicle fleet studies • Onboard sensors (individual vehicles) • Aircraft plume measurements
Courtesy: Polavarapu and Nassar Present GG satellite instruments All are nadir except ACE which is occultation (limb)
Info courtesy of Ray Nassar Future GG satellite instruments
Emission inventories: Example of choices - GHG • Emission inventories: • CO2 information • 16 global (surface; monthly, 3 hourly or annually) • 2 global-3D (Nassar et al.; monthly) • 1 US (~10 km, 3 hourly) • 1 Canada (Nassar et al., in preparation) • CO2, CH4, N2O, CO, NH3, … : 1 global (EDGAR) Info courtesy of Ray Nassar
United States AQS: A caution…http://www.epa.gov/ttn/airs/airsaqs/ • AQS has codes for measurement parameters, units and methods • There can be multiple codes for each measurement, e.g., PM2.5 data may have multiple codes for parameter, unit and method • Data and codes must be evaluated and combined when using the data