Download
1 / 36
360 likes | 499 Views
Multi-State Salinity Coalition February 18, 2011. Navigating the Regulatory and Permitting Hurdles for Concentrate Discharge. Kipp Scott, East Cherry Creek Valley Water and Sanitation District Doug Brown, P.E. CDM. Presentation Outline. Background on ECCV Project

E N D
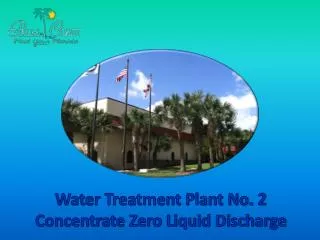
Multi-State Salinity Coalition February 18, 2011 Navigating the Regulatory and Permitting Hurdles for Concentrate Discharge Kipp Scott, East Cherry Creek Valley Water and Sanitation District Doug Brown, P.E. CDM
Presentation Outline • Background on ECCV Project • Overview of Brackish Water Reverse Osmosis (RO) Treatment • Factors Affecting Residuals Disposal for Inland Facilities • Disposal Alternatives and Regulatory Issues
Southeastern Denver Has Limited Surface Water Supplies and Relies on Imported Water or Deep Non-tributary Groundwater Where is ECCV?
Existing ECCV Water Supply Is Being Depleted and Is Not Renewable • ECCV initially relied on dozens of non-tributary groundwater for its water supply • The Arapahoe and Laramie/Fox Hills aquifers have less than 300 mg/L TDS and 100 mg/L hardness
ECCV Is Diversifying and Conserving Its Water Supply • Non-potable Irrigation with Reclaimed Water • Denver Treated Water • Block Water Rates • Conservation Incentives Reduced Demand 30% from 1995
ECCV Water Well Production will Decrease 50% in 10 Years Requiring 377 New Wells
North Booster Pump Station South Booster Pump Station Pipeline The Northern Project • Beebe Draw alluvial wells • Phase I water rights – 70 Ranch • Phase II water rights – Barr & Milton shares • Phase I facilities • Well field • Pump Stations • Waterline
Renewable Groundwater from Northern Project Being Blended with Other District Supplies
Water Treatment Planning Objectives • Consistent quality product • Free of objectionable taste and odors • Water quality meets end user requirements • Consistently meets drinking water standards • Specific water quality targets • Total Dissolved Solids < 300 mg/L • Total Hardness < 100 mg/L • Firm treatment and pumping capacity to meet peak demands • Reliable service • Reasonable operating costs
Selection of Water Treatment Process • High hardness and TDS required blending or reduction of these compounds • Blending is not a long-term solution • Lack of long-term blending sources • Reverse Osmosis selected • Most cost-effective for TDS • Only effective process to consistently meet water quality goals • Also eliminates almost all other potential contaminants from effluent dominated sources • The challenge is the disposal of the concentrate stream (brine) from the treatment process
ECCV Northern Water System 47 MGD Ultimate Capacity
Overview of RO Process and Concentrate Disposal • Typical low pressure RO operating at 85% recovery treating GW with 700 mg/L TDS & 300 mg/L hardness • 6.7 MGD of permeate blended with 3.3 MGD of UV treated well water • 1.2 MGD of concentrate with 5000 mg/L TDS
RO Concentrate Disposal Options • Discharge to Sanitary Sewer System or POTW Discharge • Surface Water Discharge through NPDES permit • navigable waters • irrigation ditches • Deep Well Injection • Beneficial Uses • Zero Liquid Discharge Using: • thermal/mechanical evaporation systems • enhanced evaporation system • passive evaporation basins
Brine Concentration & Volume Vs. Recovery 50 45 40 35 30 25 20 15 10 5 0 50 45 40 35 30 25 20 15 10 5 0 RO Concentrate TDS ppt (assume 1000 mg/L raw water) Concentrate Volume % Mass of Salt Discharged is Constant Recovery Percent
Potential Impacts of RO Concentrate on Wastewater Treatment Plant • Decreased hydraulic residence time and potential impacts on effluent BOD and TSS • Increase in effluent TDS • Potential Increase in Elements such as Radionuclides, heavy metals, nitrates • Potential Inhibitory Effect on Treatment Biology at High % of Concentrate • Potential Impact on WET Tests • Potential Impact on Equipment Corrosion
Brackish RO Concentrate Typically Does Not Exhibit Acute or Chronic Toxicity
Wastewater System Concentrate Management Options • Blend Concentrate with the Treatment Plant Effluent • Send Concentrate Through System During Off-Peak Times • Pre-treat Concentrate for Specific Contaminants of Concern: Heavy Metals, Nitrates, Radionuclides • Develop a Salt Balance for the Basin to Demonstrate No Impact on Total Salt Discharge
Adding a RO System to an Existing Water Supply Results in a Neutral Salt Balance River Irrigation Return Flow Distribution System 9.3 mgd 250 mg/L 10 tons/day Blend 40 tons/day M 2.5 mgd POTW Salt Sanitary Sewer Flow 6.8 mgd 10-mgd Existing Brackish Wells @ 1,000 mg/L TDS 7.5 mgd RO System 0.8 mgd @ 10,000 mg/L = 30 tons/day of salt
A Wide Range of Commercial and Residential Activities Add TDS to the POTW Discharge • Water softeners • Demineralization for labs, electronics manufacturing • Cooling tower blowdown • Boiler feedwater treatment • Beverage production • Laundry operations • pH adjustment
Summary of Potential RO Impacts on Wastewater Treatment Plants • Minimal Performance and Water Quality Impacts on Wastewater Treatment Plants Receiving a Small Percentage of RO Concentrate • Potential Hydraulic Impacts if RO Concentrate is a Significant Percentage of the Wastewater Treatment Flow • The Increase in Effluent TDS from a Brackish RO Concentrate Discharge Can Have an Impact on Effluent Reuse Options
Surface Water Discharge Options • Discharge to surface water • Secondary Recovery (Brine Minimization) to reduce concentrate volume to ~ 3% of RO flow • Enhanced evaporation and landfill of dry solids • Use of blowers • Pond sizing based on annual volume • Deep well disposal • Initial stage w/o secondary recovery
100 90 Daily Salt Discharge Tons / Day 80 70 60 50 40 30 20 10 Colorado Road 0 Deicing 10 mgd Municipal WWTP Discharge to Surface Water Typically Avoided Since Daily Salt Discharge from a Brackish RO Project is Significant Daily Salt Discharge Tons / Day Approx. 2400 tons of Road Salt Courtesy of NYLCV 10 mgd BWRO @2000 mg/L 10 mgd Water Softener @ 400 mg/L As CaCO3
NPDES Permit Can Be Based on Discharge Standards or Non-Degradation Criteria • TDS typically is not a discharge standard because wastewater treatment plant can’t remove it • Nitrate, metals, radionuclides are concentrated by RO and can exceed discharge standards • ECCV discharge permit to irrigation ditch was based on non-degradation of groundwater and controlled by Fluoride, uranium and gross alpha • Acute and chronic toxicity discharge standards can be impacted by common ion concentration and ratios
Zero Liquid Discharge (ZLD) Options • Thermal/mechanical evaporation systems: vapor recompression, spray dryers, crystallizers • Low tech evaporation processes: passive solar evaporation basins, enhanced evaporation basins, misters, undulating film evaporators Photo courtesy GE Infrastructure
Passive Evaporation Basins Require Extensive Land Even in Southwest Desert
High Recovery RO Using both WAC and SAC Conc. Brine Conc. Brine Conc. Brine • Removes Ions That • Form Scale • Calcium • Magnesium • Barium • Strontium • Iron • Manganese • Aluminum Ground Water Strong Acid Cation IX Weak Acid Cation IX Reverse Osmosis High Purity Water Hardness Removal Polyvalent Cations High pH Separation • Ambient pH RO Operation • Controls Silica Scaling • Eliminates NaOH Feed
A Low-Cost Solar Basin with an Air Sparger Can Increase Evaporation Rates RO Concentrate Basin Liners Gravel Diffuser Layer Air Distribution Grid
Deep Wells Can Be Used for Final Disposal of Concentrated Brine • 23 operating injection wells in Adams and Weld Counties (47 permitted by the State O&G Div.) • ECCV well - EPA permit for a Class 1 well • Underground formations 9,000+ feet below drinking water aquifers and 1,400 ft. above Rocky Mountain Arsenal wells • Estimated injection rate of 200 to 400 gpm • Estimated cost of $2,280,000 per completed well + pipeline from plant to well
Brine Injected Below Potable Water Aquifers • Injection wells include outer casing and inner casing to create and annular space that can be monitored for leaks • Corrosion resistent materials compatible with salty brines • Chemical stability of brines during and after injection
Deep Well Disposal Option Secondary concentration of RO concentrate using brine minimization to 3% of flow treated to minimize water rights loss and # of deep disposal wells
ECCV Phase 1 Low Pressure RO and Brine Minimization System UV Disinfection 3.3 MGD By-Pass Blend 10.8 MGD Blend 7.8 MGD Ground Water 6.6 MGD Permeate LPRO @ 85% 140 psi 50 mg/L TDS 700 mg/L TDS 300 mg/L TDS Brine Minimization 1.2 MGD Concentrate High Recovery RO @ 75% 4600 mg/L TDS Pre-treatment 0.9 MGD Permeate 500 mg/L TDS 0.3 MGD Brine @ Residuals 18,000 mg/L TDS Acid Deep Well Injection High pressure Injection Pump 10,000 ft. Deep Class I Injection Well
Total Estimated ECCV ZLD O&M costs per 1,000 gallons of net water production
Thank you, and Time for Questions • Doug Brown • 303-383-2316 direct • 303-915-3042 cell • BROWNDR@CDM.COM