Download
1 / 23
230 likes | 349 Views
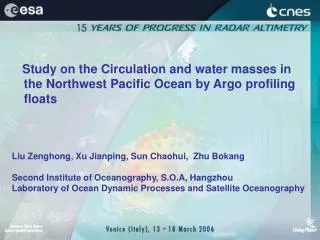
Study on the Circulation and water masses in the Northwest Pacific Ocean by Argo profiling floats Liu Zenghong, Xu Jianping, Sun Chaohui, Zhu Bokang Second Institute of Oceanography, S.O.A, Hangzhou Laboratory of Ocean Dynamic Processes and Satellite Oceanography. Content

E N D
Study on the Circulation and water masses in the Northwest Pacific Ocean by Argo profiling floats Liu Zenghong, Xu Jianping, Sun Chaohui, Zhu Bokang Second Institute of Oceanography, S.O.A, Hangzhou Laboratory of Ocean Dynamic Processes and Satellite Oceanography
Content • The float drifting tracks and speed analysis • T/S characteristics of the Northwest Pacific and their distribution • Mesoscale eddy observed by Argo float • Conclusion
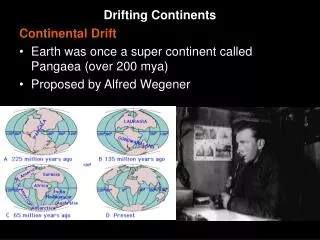
NECC: ~5ºN NEC:8~20ºN STCC:20~25ºN NEC bifurcates near 13~14ºN at the western boundary (The Kuroshio, and Mindanao Current) (Stramma et al.)
29 floats were deployed in the Northwest Pacific and Eastern Indian during 2002-2005 by CHINA ARGO PROJECT.
Trajectories of all floats during 2002-2005 in the Northwestern Pacific (Stramma et al.)
ADCP observed current vectors (Jan,2003) Kuroshio Kuroshio STCC STCC NEC bifurcate bifurcate NEC NECC NECC MC MC 75-100m layer 25-50m layer
WMO:5900317 NECC MC Mean: 5cm/s
T/S characteristics of the Northwest Pacific and their distribution
NPTSW NPSSW SPSSW NPSTW NPIW SPIW (AAIW) NPDW T-S diagram of all profiles (October 2002 – December 2005)
The characteristics of the water masses in the observational region
North of 12N South of 12N SPSSW SPIW
WMO:5900222 WMO:5900226 5900222 5900226 WMO:5900317 5900317
WMO:5900224 (Jan – Oct,2003) surface 1500 dbar MC For the details see the meeting poster!
Compare with SODA data (by Hui Zhou et al, 2005) Argo SODA Surface Jan-Mar Apr-Jul Aug-Oct 1500 dbar
Conclusion • The trajectories or estimated surface currents of the Argo float are mainly consistent with the current system in this region. • About 8 water masses were observed by these floats. South of 12ºN, the influence of South Pacific sources (SPSSW,SPIW) becomes obvious. The NPIW is not seen in the area south of 5ºN. • To the south more, the seasonal variability of the salinities is more obvious, due to the influence of South Pacific high salinity water. • An anticyclonic eddy was observed at the depth of ~1500dbar east of Mindanao Island during Jan – Oct, 2003, which shows the good agreement with the SODA velocity fields.
The Argo float deployments provide much more near real-time T/S data of the subsurface, as well as the time and position messages. Argo data have been used to estimate current velocities at the mid-depth (Park,et al), decadal variation in the formation of STMW (Bo Qiu), mesoscale eddy effects on the formation of STMW (Pan,et al), the characteristics of Rossby wave in STCC region (Zheng,et al), upper ocean response to the typhoons (Park, et al), and so on…
WMO: 5900019 Θ = 2.8℃ Θ = 4.5℃
AAIW:27-27.4 sigmat,34.4-34.6psu, 4-7℃ NPIW:26.5-26.8 sigmat,34.1-34.4psu, 4-10℃ AAIW