Download
1 / 34
390 likes | 705 Views
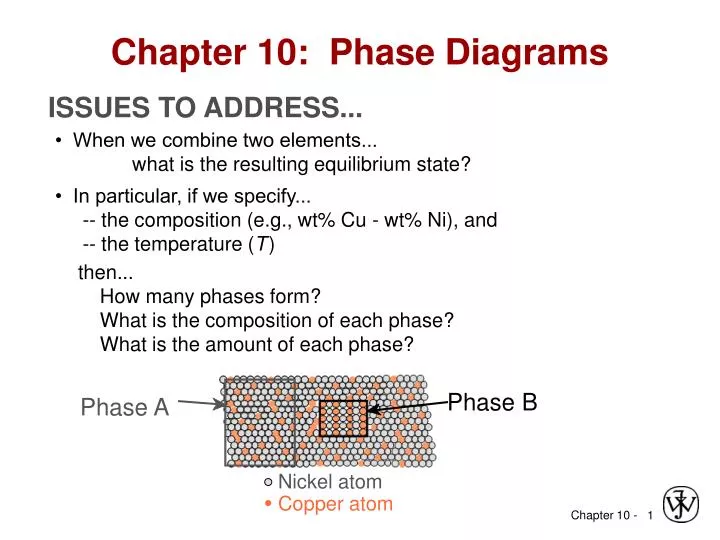
Chapter 10: Phase Diagrams. Phase B. Phase A. Nickel atom. Copper atom. ISSUES TO ADDRESS. • When we combine two elements... what is the resulting equilibrium state?. • In particular, if we specify... -- the composition (e.g., wt% Cu - wt% Ni), and

E N D
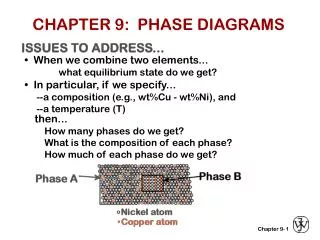
Chapter 10: Phase Diagrams Phase B Phase A Nickel atom Copper atom ISSUES TO ADDRESS... • When we combine two elements... what is the resulting equilibrium state? • In particular, if we specify... -- the composition (e.g., wt% Cu - wt% Ni), and -- the temperature (T) then... How many phases form? What is the composition of each phase? What is the amount of each phase?
T(°C) 1600 1500 L (liquid) 1400 a liquidus + 1300 L solidus a 1200 (FCC solid 1100 solution) 1000 wt% Ni 0 20 40 60 80 100 Phase Diagrams • Indicate phases as a function of T, C, and P. • For this course: - binary systems: just 2 components. - independent variables: T and C (P = 1 atm is almost always used). • 2 phases: Phase Diagram for Cu-Ni system L (liquid) a (FCC solid solution) • 3 different phase fields: L a L + a Adapted from Fig. 10.3(a), Callister & Rethwisch 3e. (Fig. 10.3(a) is adapted from Phase Diagrams of Binary Nickel Alloys, P. Nash (Ed.), ASM International, Materials Park, OH (1991).
T(°C) 1600 1500 L (liquid) 1400 a liquidus + 1300 L solidus a 1200 (FCC solid 1100 solution) 1000 wt% Ni 0 20 40 60 80 100 Isomorphous Binary Phase Diagram • Phase diagram: Cu-Ni system. • System is: Cu-Ni phase diagram -- binary i.e., 2 components: Cu and Ni. -- isomorphous i.e., complete solubility of one component in another; a phase field extends from 0 to 100 wt% Ni. Adapted from Fig. 10.3(a), Callister & Rethwisch 3e. (Fig. 10.3(a) is adapted from Phase Diagrams of Binary Nickel Alloys, P. Nash (Ed.), ASM International, Materials Park, OH (1991).
T(°C) 1600 1500 L (liquid) 1 phase: a B (1250°C, 35 wt% Ni): (1250°C,35) 1400 liquidus 2 phases: L + a a + 1300 solidus L B a (FCC solidsolution) 1200 A(1100°C,60) 1100 1000 wt% Ni 0 20 40 60 80 100 Phase Diagrams:Determination of phase(s) present • Rule 1: If we know T and Co, then we know: -- which phase(s) is (are) present. • Examples: A(1100°C, 60 wt% Ni): Adapted from Fig. 10.3(a), Callister & Rethwisch 3e. (Fig. 10.3(a) is adapted from Phase Diagrams of Binary Nickel Alloys, P. Nash (Ed.), ASM International, Materials Park, OH (1991).
Cu-Ni system T(°C) A TA tie line liquidus L (liquid) At TA = 1320°C: 1300 a + L Only Liquid (L) present B TB solidus CL = C0 ( = 35 wt% Ni) a a At TD = 1190°C: + L (solid) 1200 D Only Solid (a) present TD C = C0 ( = 35 wt% Ni) 32 35 4 3 20 30 40 50 At TB = 1250°C: CL C0 C wt% Ni Both and L present CL = C ( = 32 wt% Ni) liquidus C = C ( = 43 wt% Ni) solidus Phase Diagrams:Determination of phase compositions • Rule 2: If we know T and C0, then we can determine: -- the composition of each phase. • Examples: Consider C0 = 35 wt% Ni Adapted from Fig. 10.3(a), Callister & Rethwisch 3e. (Fig. 10.3(a) is adapted from Phase Diagrams of Binary Nickel Alloys, P. Nash (Ed.), ASM International, Materials Park, OH (1991).
Phase Diagrams:Determination of phase weight fractions Cu-Ni system T(°C) A TA liquidus tie line L (liquid) At TA : Only Liquid (L) present 1300 a + L B WL= 1.00, Wa = 0 TB solidus At TD : Only Solid ( ) present S R a a + WL = 0, W = 1.00 L a (solid) 1200 D TD At TB : Both and L present 32 35 4 3 20 3 0 4 0 5 0 S = WL CL C0 Ca wt% Ni R + S R = = 0.27 Wa R + S • Rule 3: If we know T and C0, then can determine: -- the weight fraction of each phase. • Examples: Consider C0 = 35 wt% Ni Adapted from Fig. 10.3(a), Callister & Rethwisch 3e. (Fig. 10.3(a) is adapted from Phase Diagrams of Binary Nickel Alloys, P. Nash (Ed.), ASM International, Materials Park, OH (1991).
T(°C) tie line liquidus L (liquid) 1300 a + M ML L B solidus T B a a + L (solid) 1200 R S S R 20 3 0 4 0 5 0 C0 CL C wt% Ni The Lever Rule • Tie line – connects the phases in equilibrium with each other – also sometimes called an isotherm • What fraction of each phase? Think of the tie line as a lever • (teeter-totter) Adapted from Fig. 10.3(b), Callister & Rethwisch 3e.
Ex: Cooling of a Cu-Ni Alloy L: 35 wt% Ni B a: 46 wt% Ni 35 46 C 32 43 D L: 32 wt% Ni 24 36 a: 43 wt% Ni E L: 24 wt% Ni a: 36 wt% Ni • Phase diagram: Cu-Ni system. T(°C) L: 35wt%Ni L (liquid) Cu-Ni system a • Consider microstuctural changes that accompany the cooling of a C0 = 35 wt% Ni alloy 130 0 A + L a + 120 0 L a (solid) 110 0 35 20 3 0 4 0 5 0 wt% Ni C0 Adapted from Fig. 10.4, Callister & Rethwisch 3e.
Cored vs Equilibrium Structures Last a to solidify: < 35 wt% Ni • Ca changes as we solidify. • Cu-Ni case: First a to solidify has Ca = 46 wt% Ni. Last a to solidify has Ca = 35 wt% Ni. • Slow rate of cooling: Equilibrium structure • Fast rate of cooling: Cored structure Uniform Ca: First a to solidify: 35 wt% Ni 46 wt% Ni
60 %EL for pure Cu 400 %EL for 50 pure Ni TS for Elongation (%EL) 40 pure Ni Tensile Strength (MPa) 300 30 TS for pure Cu 200 20 0 20 40 60 80 100 0 20 40 60 80 100 Cu Ni Cu Ni Composition, wt% Ni Composition, wt% Ni Mechanical Properties:Cu-Ni System • Effect of solid solution strengthening on: -- Tensile strength (TS) -- Ductility (%EL) Adapted from Fig. 10.6(a), Callister & Rethwisch 3e. Adapted from Fig. 10.6(b), Callister & Rethwisch 3e.
Binary-Eutectic Systems • Eutectic reaction L(CE) (CE) + (CE) cooling heating has a special composition with a min. melting T. 2 components Cu-Ag system T(°C) Ex.: Cu-Ag system 1200 • 3 single phase regions L (liquid) (L, a, b) 1000 a L + a • Limited solubility: b L + 779°C b 800 TE a: mostly Cu 8.0 91.2 71.9 b: mostly Ag 600 • TE : No liquid below TE a + b 400 • CE : Composition at temperature TE 200 80 100 0 20 40 60 CE C , wt% Ag Adapted from Fig. 10.7, Callister & Rethwisch 3e.
EX 1: Pb-Sn Eutectic System T(°C) 300 L (liquid) a L + a b b L + 200 183°C 18.3 61.9 97.8 C- C0 150 S R S = W = R+S C- C 100 a + b 99 - 40 59 = = = 0.67 99 - 11 88 100 0 11 20 60 80 99 40 C0- C R W C C C0 = = C, wt% Sn C - C R+S 40 - 11 29 = = 0.33 = 99 - 11 88 • For a 40 wt% Sn-60 wt% Pb alloy at 150°C, determine: -- the phases present Pb-Sn system Answer: a + b -- the phase compositions Answer: Ca = 11 wt% Sn Cb = 99 wt% Sn -- the relative amount of each phase Answer: Adapted from Fig. 10.8, Callister & Rethwisch 3e.
EX 2: Pb-Sn Eutectic System T(°C) CL - C0 46 - 40 = W = a CL - C 46 - 17 300 L (liquid) 6 a L + = = 0.21 29 220 a b b R L + S 200 183°C 100 a + b 100 17 46 0 20 40 60 80 C CL C0 C, wt% Sn C0 - C 23 = WL = = 0.79 CL - C 29 • For a 40 wt% Sn-60 wt% Pb alloy at 220°C, determine: -- the phases present: Pb-Sn system Answer: a + L -- the phase compositions Answer: Ca = 17 wt% Sn CL = 46 wt% Sn -- the relative amount of each phase Answer: Adapted from Fig. 10.8, Callister & Rethwisch 3e.
Microstructural Developments in Eutectic Systems I T(°C) L: C0wt% Sn 400 L a L 300 L a + a 200 (Pb-Sn a: C0wt% Sn TE System) 100 b + a 0 10 20 30 C , wt% Sn C0 2 (room T solubility limit) • For alloys for which C0 < 2 wt% Sn • Result: at room temperature -- polycrystalline with grains of a phase having composition C0 Adapted from Fig. 10.11, Callister & Rethwisch 3e.
Microstructural Developments in Eutectic Systems II L: C0 wt% Sn T(°C) 400 L L 300 a L + a a: C0wt% Sn a 200 TE a b 100 b + a Pb-Sn system 0 10 20 30 C , wt% Sn C0 2 (sol. limit at T ) 18.3 room (sol. limit at TE) • For alloys for which 2 wt% Sn < C0 < 18.3 wt% Sn • Result: at temperatures in a + b range -- polycrystalline with agrains and small b-phase particles Adapted from Fig. 10.12, Callister & Rethwisch 3e.
Microstructural Developments in Eutectic Systems III Micrograph of Pb-Sn T(°C) eutectic L: C0 wt% Sn microstructure 300 L Pb-Sn system a L + a b L 200 183°C TE 100 160m a : 97.8 wt% Sn Adapted from Fig. 10.14, Callister & Rethwisch 3e. : 18.3 wt%Sn 0 20 40 60 80 100 97.8 18.3 CE C, wt% Sn 61.9 • For alloy of composition C0 = CE • Result: Eutectic microstructure (lamellar structure) -- alternating layers (lamellae) of a and b phases. Adapted from Fig. 10.13, Callister & Rethwisch 3e.
Lamellar Eutectic Structure Adapted from Figs. 10.14 & 10.15, Callister & Rethwisch 3e.
Microstructural Developments in Eutectic Systems IV • Just above TE : L T(°C) L: C0 wt% Sn Ca = 18.3 wt% Sn L CL = 61.9 wt% Sn 300 L Pb-Sn system S Wa L + = 0.50 = R + S a b WL = (1- W ) = 0.50 L + a R S 200 TE S R • Just below TE : C = 18.3 wt% Sn 100 + a primary C = 97.8 wt% Sn a eutectic S b eutectic W = 0.73 = R + S 0 20 40 60 80 100 W = 0.27 18.3 61.9 97.8 Adapted from Fig. 10.16, Callister & Rethwisch 3e. C, wt% Sn • For alloys for which 18.3 wt% Sn < C0 < 61.9 wt% Sn • Result:a phase particles and a eutectic microconstituent
Hypoeutectic & Hypereutectic hypoeutectic: C0 = 50 wt% Sn hypereutectic: (illustration only) (Figs. 10.14 and 10.17 from Metals Handbook, 9th ed., Vol. 9, Metallography and Microstructures, American Society for Metals, Materials Park, OH, 1985.) a b a b a a b b a b a b 175 mm Adapted from Fig. 10.17, Callister & Rethwisch 3e. Adapted from Fig. 10.17, Callister & Rethwisch 3e. (Illustration only) 300 L T(°C) Adapted from Fig. 10.8, Callister & Rethwisch 3e. (Fig. 10.8 adapted from Binary Phase Diagrams, 2nd ed., Vol. 3, T.B. Massalski (Editor-in-Chief), ASM International, Materials Park, OH, 1990.) a L + a b b L + (Pb-Sn 200 TE System) a + b 100 C, wt% Sn 0 20 40 60 80 100 eutectic 61.9 eutectic: C0=61.9wt% Sn 160 mm eutectic micro-constituent Adapted from Fig. 10.14, Callister & Rethwisch 3e.
Intermetallic Compounds Adapted from Fig. 10.20, Callister & Rethwisch 3e. Mg2Pb Note: intermetallic compound exists as a line on the diagram - not an area - because of stoichiometry (i.e. composition of a compound is a fixed value).
cool cool cool heat heat heat • Eutectoid – one solid phase transforms to two other solid phases • S2S1+S3 • + Fe3C (For Fe-C, 727C, 0.76 wt% C) intermetallic compound - cementite • Peritectic - liquid and one solid phase transform to a second solid phase • S1 + LS2 • + L (For Fe-C, 1493°C, 0.16 wt% C) Eutectic, Eutectoid, & Peritectic • Eutectic - liquid transforms to two solid phases L + (For Pb-Sn, 183C, 61.9 wt% Sn)
Peritectic transformation + L Eutectoid transformation + Eutectoid & Peritectic Cu-Zn Phase diagram Adapted from Fig. 10.21, Callister & Rethwisch 3e.
Ceramic Phase Diagrams MgO-Al2O3 diagram: Adapted from Fig. 10.24, Callister & Rethwisch 3e.
T(°C) 1600 d - Eutectic (A): L 1400 Þ g + L Fe3C g +L g A 1200 1148°C - Eutectoid (B): (austenite) g Þ a + Fe3C g g 1000 g +Fe3C g g a Fe3C (cementite) + 800 B g a 727°C = T eutectoid 600 a +Fe3C 400 0 1 2 3 4 5 6 6.7 4.30 0.76 C, wt% C (Fe) 120 mm Result: Pearlite = Fe3C (cementite-hard) alternating layers of a (ferrite-soft) a and Fe3C phases (Adapted from Fig. 10.31, Callister & Rethwisch 3e.) Adapted from Fig. 10.28,Callister & Rethwisch 3e. Iron-Carbon (Fe-C) Phase Diagram • 2 important points L+Fe3C
T(°C) 1600 d L 1400 (Fe-C g +L g g g System) 1200 L+Fe3C 1148°C (austenite) g g g 1000 g g +Fe3C g g Fe3C (cementite) a g g 800 727°C a a a g g 600 a +Fe3C 400 0 1 2 3 4 5 6 6.7 a C, wt% C (Fe) C0 0.76 pearlite Hypoeutectoid 100 mm steel pearlite proeutectoid ferrite Adapted from Fig. 10.34, Callister & Rethwisch 3e. Hypoeutectoid Steel Adapted from Figs. 10.28 and 10.33,Callister & Rethwisch 3e. (Fig. 10.28 adapted from Binary Alloy Phase Diagrams, 2nd ed., Vol. 1, T.B. Massalski (Ed.-in-Chief), ASM International, Materials Park, OH, 1990.)
T(°C) 1600 d L 1400 (Fe-C g +L g System) 1200 L+Fe3C 1148°C (austenite) 1000 g +Fe3C Wa’= S/(R+S) Wa= s/(r+s) Fe3C (cementite) a r s g g 800 Wg=(1 - Wa) W=(1 – Wa’) 727°C a a a g g R S 600 a +Fe3C 400 0 1 2 3 4 5 6 6.7 a C, wt% C (Fe) C0 0.76 Wpearlite=Wg pearlite Hypoeutectoid 100 mm steel Fe3C pearlite proeutectoid ferrite Adapted from Fig. 10.34, Callister & Rethwisch 3e. Hypoeutectoid Steel Adapted from Figs. 10.28 and 10.33,Callister & Rethwisch 3e. (Fig. 10.28 adapted from Binary Alloy Phase Diagrams, 2nd ed., Vol. 1, T.B. Massalski (Ed.-in-Chief), ASM International, Materials Park, OH, 1990.)
T(°C) 1600 d L 1400 (Fe-C g +L g g g System) 1200 L+Fe3C 1148°C g g (austenite) g 1000 g g +Fe3C g g Fe3C (cementite) Fe3C 800 g g a g g 600 a +Fe3C 400 0 1 2 3 4 5 6 6.7 C, wt%C (Fe) pearlite Hypereutectoid 60mm steel pearlite proeutectoid Fe3C Adapted from Fig. 10.37, Callister & Rethwisch 3e. Hypereutectoid Steel Adapted from Figs. 10.28 and 10.36,Callister & Rethwisch 3e. (Fig. 10.28 adapted from Binary Alloy Phase Diagrams, 2nd ed., Vol. 1, T.B. Massalski (Ed.-in-Chief), ASM International, Materials Park, OH, 1990.) C0 0.76
T(°C) 1600 d L 1400 (Fe-C g +L g Fe3C System) 1200 L+Fe3C 1148°C (austenite) 1000 g +Fe3C Wg=x/(v + x) Fe3C (cementite) x v 800 g W=(1-Wg) g Fe3C a g g V X 600 a +Fe3C 400 0 1 2 3 4 5 6 6.7 C, wt%C (Fe) pearlite Wpearlite=Wg Wa= X/(V+X) Hypereutectoid 60mm W=(1 - Wa) steel Fe3C’ pearlite proeutectoid Fe3C Adapted from Fig. 10.37, Callister & Rethwisch 3e. Hypereutectoid Steel Adapted from Figs. 10.28 and 10.36,Callister & Rethwisch 3e. (Fig. 10.28 adapted from Binary Alloy Phase Diagrams, 2nd ed., Vol. 1, T.B. Massalski (Ed.-in-Chief), ASM International, Materials Park, OH, 1990.) C0 0.76
Example Problem For a 99.6 wt% Fe-0.40 wt% C steel at a temperature just below the eutectoid, determine the following: • The compositions of Fe3C and ferrite (). • The amount of cementite (in grams) that forms in 100 g of steel. • The amounts of pearlite and proeutectoid ferrite () in the 100 g.
1600 d L 1400 T(°C) g +L g 1200 L+Fe3C 1148°C (austenite) 1000 g +Fe3C Fe3C (cementite) 800 727°C Amount of Fe3C in 100 g = (100 g)WFe3C = (100 g)(0.057) = 5.7 g R S 600 a +Fe3C 400 0 1 2 3 4 5 6 6.7 C0 C C, wt% C CFe C 3 Solution to Example Problem a) Using the RS tie line just below the eutectoid Ca = 0.022 wt% CCFe3C = 6.70 wt% C • Using the lever rule with the tie line shown
1600 d L 1400 T(°C) g +L g 1200 L+Fe3C 1148°C (austenite) 1000 g +Fe3C Fe3C (cementite) 800 727°C V X Amount of pearlite in 100 g = (100 g)Wpearlite = (100 g)(0.512) = 51.2 g 600 a +Fe3C 400 C0 0 1 2 3 4 5 6 6.7 C C C, wt% C Solution to Example Problem (cont) c) Using the VX tie line just above the eutectoid and realizing that C0 = 0.40 wt% CCa = 0.022 wt% CCpearlite = C = 0.76 wt% C
Alloying with Other Elements • Teutectoid changes: • Ceutectoid changes: (wt% C) Ti Si Mo (°C) Ni W Cr Cr eutectoid Eutectoid Si Mn W Mn Ti Mo C T Ni wt. % of alloying elements wt. % of alloying elements Adapted from Fig. 10.38,Callister & Rethwisch 3e. (Fig. 10.38 from Edgar C. Bain, Functions of the Alloying Elements in Steel, American Society for Metals, 1939, p. 127.) Adapted from Fig. 10.39,Callister & Rethwisch 3e. (Fig. 10.39 from Edgar C. Bain, Functions of the Alloying Elements in Steel, American Society for Metals, 1939, p. 127.)
Summary • Phase diagrams are useful tools to determine: -- the number and types of phases present, -- the composition of each phase, -- and the weight fraction of each phase given the temperature and composition of the system. • The microstructure of an alloy depends on -- its composition, and -- whether or not cooling rate allows for maintenance of equilibrium. • Important phase diagram phase transformations include eutectic, eutectoid, and peritectic.
ANNOUNCEMENTS Reading: Core Problems: Self-help Problems:


![Thermal Behavior – II Free Energy & Phase Diagrams [partly based on Chapter 7, Sholl & Steckel]](https://cdn1.slideserve.com/3337775/thermal-behavior-ii-free-energy-phase-diagrams-partly-based-on-chapter-7-sholl-steckel-dt.jpg)