Download
1 / 15
150 likes | 253 Views
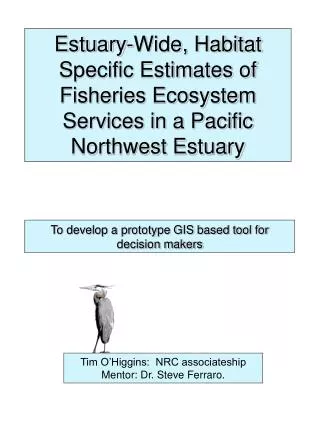
Prototype GIS tool for Pacific Northwest estuary fisheries ecosystem services, using habitat-specific estimates to assist decision-makers. Economic valuation data included for various habitats and fisheries.

E N D
Estuary-Wide, Habitat Specific Estimates of Fisheries Ecosystem Services in a Pacific Northwest Estuary To develop a prototype GIS based tool for decision makers Tim O’Higgins: NRC associateship Mentor: Dr. Steve Ferraro.
DEFINITIONS “Ecosystem services are the benefits obtained by humans from ecosystems” MEA, 2005 “Final ecosystem services are the components of nature, directly enjoyed, consumed or used to yield human well being” Boyd & Banzhaf, 2007
Estuaries Yaquina (OR) Humboldt Bay (CA)-Lagoon Pond Narragansett (MA)-Nanatucket Bay (MA)-Weeks Bay (AL)-Tampa Bay (Fl) Habitat Types Eelgrass- Unvegetated sediments- Oyster-Burrowing shrimp-Subtidal Biodiversity As a support function Fisheries * Commercial: Commercial Landings (lb) x Ex-vessel (at the gate) value (per lb)= EV Benthic macrofauna Nekton Birds Ranking Species richness abundance biomass Rarity Aggregation Fitness consequences Proportional importance Pacific oyster $32m Dungeness crab $97m Salmon (Coho + Chinook) $16m Bay clams $91,976 Ghost shrimp $71,585 Mud shrimp $3,300 Nutrient cycling Nitrogen, Carbon Recreational Number of recreational trips x Willingness to pay per trip= EV Algae Eelgrasses kg.N.day-1 removed Avoidance cost $ *Fisheries data for Oregon and Washington from NOAA landings statistics 2006
Newport Oregon Habitat Types Within The Yaquina Estuary
Fishery MinValue Max Value Confidence $ $ Oyster 560,280 560,280 Commercial Good Crab 7,430 7,430 Commercial Good 1,134,856 2,269,660 Recreational Poor 168,000 168,000 Contribution to ocean commercial Good Salmon 540,845 1,289,563 Recreational Poor 1,736,986 Commercial/ocean Poor Shrimp 23,839 23,839 Recreational Average Clams 406,283 406,283 Recreational Average Total 2,841,533 6,462,040 Economic valuation of commercial and recreational fisheries in the Yaquina estuary Data Sources 5 2 9 8 Total=24
38% 62% $2.5m $4m EV = EVhab1x A1 + EVhab2 x A2… EVhabi x Ai
PACIFIC OYSTER AQUACULTURE EV = EVhab1x A1 + EVhab2 x A2… EVhabi x Ai
Dungeness Crab EV= $2,445,090 Relative habitat values obtained from graph using datathief software Areas from GIS Holsman, 2006 EV = (EVULHx AULH) + (EVEEL x AEEL)+ (EVSUB x ASUB) EV=(EVULH x AULH)+(0.4 x EVULH x AEEL)+ (4 x EVULH x ASUB) EV= EVULH( AULH+ 0.4AEEL+4ASUB) EVULH= EV/( AULH+ 0.4AEEL+4ASUB)
Recreational harvest value Burrowing shrimp species
Combined value for each fishery type Mean values for each habitat type Oyster $3,200 acre-1y-1 Subtidal $2,000 acre-1y-1 Mixed $1,600 acre-1y-1 Bare $1,600acre-1y-1 Neo $1,500acre-1y-1 Upo $1,400acre-1y-1 Eelgrass $1,200acre-1y-1
CAVEAT EMPTOR • Choice of classification is arbitrary EV = EVhab1x A1 + EVhab2 x A2… EVhabi x Ai Assumes the total value of the estuary is the sum of its habitat types • Limited to 6 fisheries • Harvest data for clams and shrimp and crab are almost 30 years old • Assumptions about recreational catch per unit effort in the crab example doubled the value- NEED NEW RESOURCE USE STUDIES • Intercomparability-different fisheries • Marginal value of habitats • Ontogenetic shifts • Benefit transfers used for everything except crab- ZIP CODES
High resolution local scale Mean values for each habitat type Oyster $3,200 acre-1y-1 Subtidal $2,000 acre-1y-1 Mixed $1,600 acre-1y-1 Bare $1,600acre-1y-1 Neo $1,500acre-1y-1 Upo $1,400acre-1y-1 Eelgrass $1,200acre-1y-1
High resolution local scale • Framework for application in many locations Combined value for each fishery type Mean values for each habitat type Oyster $3,200 acre-1y-1 Subtidal $2,000 acre-1y-1 Mixed $1,600 acre-1y-1 Bare $1,600acre-1y-1 Neo $1,500acre-1y-1 Upo $1,400acre-1y-1 Eelgrass $1,200acre-1y-1
High resolution local scale • Framework for application in many locations • User friendly tool for decision making Combined value for each fishery type Mean values for each habitat type Oyster $3,200 acre-1y-1 Subtidal $2,000 acre-1y-1 Mixed $1,600 acre-1y-1 Bare $1,600acre-1y-1 Neo $1,500acre-1y-1 Upo $1,400acre-1y-1 Eelgrass $1,200acre-1y-1