Download
1 / 25
250 likes | 335 Views
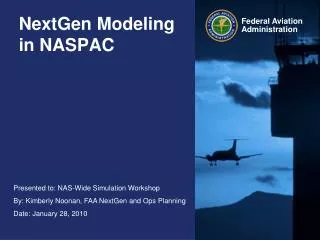
The Modernized NASPAC Simulation Environment. Your Father’s NASPAC. National Airspace System Performance Analysis Capability. The FAA’s standard system-wide model Originally developed in late 1980s Represents NAS as network of interconnected queues Airports TRACONs En route sectors

E N D
Your Father’s NASPAC National Airspace System Performance Analysis Capability • The FAA’s standard system-wide model • Originally developed in late 1980s • Represents NAS as network of interconnected queues • Airports • TRACONs • En route sectors • Discrete-event • SIMSCRIPT II.5 • Fortran, C, Pascal pre-processors • Sun Solaris platform • Used mainly for investment analysis (i.e., cost-benefit analysis)
Sector Entry/Exit Times Output Trace Files 4D Trajectories TAF Trajectory Builder Future Demand Generator Itinerary Purge Sector Crossings Core Queuing Model Fix Inserter OAG ETMS Sector Geometries Routes ETMS Sector Capacities Airport Capacities Flow Restrictions Legacy NASPAC Environment TAF = Terminal Area Forecast OAG = Official Airline Guide ETMS = Enhanced Traffic Management System
Objectives of Modernized NASPAC • Make available to more analysts and projects • Maintain fast run time • Incorporate traditional trajectory module with fuel burn computation • Automate airport weather scheduler • Obtain modern, configuration-controlled, documented source code • Produce standard, analyst-friendly, repeatable output • Validate • Develop GUI and output visualization tools • Facilitate Monte Carlo simulation
Δ Fuel Burn Modernized NASPAC Environment Wx Delay Fuel Burn Rate TAF Future Schedule Generator ETMS Constrained Traj.-Based Forecast (2D) 4D Trajectories Unconstrained Traj.-Based Forecast (2D) Legacy NASPAC Sector Entry/Exit Times Flight Table Industry/ Regulatory Response Itinerary Generation Fleet Evolution Java Trajectory Module Output Parser Sector Crossings Core Queuing Model Airport Table Sector Table Unsatisfied Demand Sector Geometries Wind Field Fleet Forecast Flight Delays Sector Capacities Pareto Curves Capacity Scheduler Wx Airport Capacities Wx = weather TAF = Terminal Area Forecast MAP = Monitor Alert Parameter ETMS = Enhanced Traffic Management System MAP Values Flow Restrictions
Airport B Airport A Airport C 2007 ETMS Airport D Airport B Airport A Airport C 2010 Forecast Airport D Future Traffic Generation • FAA airport forecasts are unconstrained • Yield excessive and unrealistic future delays at some airports • Estimated airport capacities used to constrain traffic growth • Mimic operator and FAA response to large demand and capacity imbalances • Apply both schedule smoothing and trimming at 110 airports TAF
Itinerary Generation • Constrained schedule consists of ETMS flight legs • No tail numbers • Create aircraft itineraries • Link flight legs with same airline and aircraft type • Minimize total fleet size, i.e. number of itineraries • Respect schedule turn time constraints ATL Flight Leg arriving ATL A Flight Leg Departing ATL B Flight Leg Departing ATL C Min schedule turn time
Fleet Evolution • Retire and replace aircraft with newer types • minimize changes across seat-class/engine-type categories • Consistent with APO and Mitre Fleet Forecast • Domestic passenger and cargo airlines only
Java Trajectory Module • Aircraft performance • BADA 3.6 tables • Waypoints / cruise alt. • ETMS flight plan • Arrival/departure fixes • Assigned to flight path • Wind data • NCEP/NCARGlobal Reanalysis Model • 4D track points computed at 1 min. intervals
Airspace Modeled 939 airspace elements
OEP Airports Other Airports Washington Dulles International Airport Capacities Airports Modeled • All IFR flights touching U.S. airspace are modeled • Arrival/departure capacities for 110 airports included • All other airports assumed to have infinite capacity • VFR flights at 73 airports included
Output Files Input Files Perl Scripts Airport Capacity File (airportc) ATO-P Input Schedule pre-configuration File Sector Capacity File (sector_sim) sim-configuration File Flight File Oracle Database Output Files Airport File Arrival Trace File(t_arr) Arrivals-Departures at Sink Trace File(t_snk) At-Gate Trace File(t_agt) Change Parameter File (change_apt) Cross Arrival Fix-Departure Fix-Restriction Trace File(t_cnd) Departure Trace File(t_dep) Enter-Exit Sector Trace File(t_sec) IFR Trajectories(traject) JTM Bad Flights File JTM Flight Map File JTM Fuel Usage File JTM Generate Itineraries Schedule Pushback Trace File(t_pbk) Sector File
Metrics • Flights accommodated • Flight trimming process • Delay • Gate push-back • Departure runway/fix queuing • Sector queuing • Arrival fix/runway queuing • Fuel Burn • Origin to Destination • US airspace • CO2 • Jet A savings converted to CO2 using multiplier of 21.095 lb/gal
Validation Process Every new software release validated! • Run simulation for eight historical days • Demand variation • Two days per season (1 weekend, 1 weekday) • Weather variation • Actual weather used for each day • Distribution of surface and en route weather • Compute flight time, delay, fuel burn metrics • Compare validation metrics to observed system response • Ground Truth ≡ ASPM, ASQP, BTS databases • Mean, variance • Pooled, pair-wise statistics
Airborne Delay, OEP Airports ORD FLL v5d 19 Oct. 2006
Push-Back Delay v5d
Airport Arrival Rate, 19 Oct. 2006 Charlotte-Douglas International Airport v5d
2.8% diff. Fuel Burn
Conclusions • Modernized model runs much faster, accessible to more users, and easier to use • Deterministic trajectory model provides easy means of specifying flight trajectories • Uses standard Eurocontrol BADA data • Fuel burn computation integrated into trajectory model • Accommodates wind field • Achieves good accuracy in nominal flight time and fuel burn • Airborne delays close to observed values • Surface delays appear underestimated
Next Steps • Evolve International carrier fleet • Enhance airport capacity model • Incorporate additional airport pareto curves based on alternative configurations and/or wind conditions • Improve taxi-out delay • Update departure fix en trail constraints • Incorporate Traffic Flow Management (TFM) • Ground Delay Programs • Include Monte Carlo simulation capability • Validation, validation, validation