Download
1 / 8
90 likes | 221 Views
Testing of LeCroy 1877S TDCs. Overview What is sparsification ? Why do we want to use it? How do we test it? . 0.5 ns resolution 96 channels Sparsification. Eric Jensen (W&M) A1n Collaboration Meeting May 25 , 2012. Sparsification.

E N D
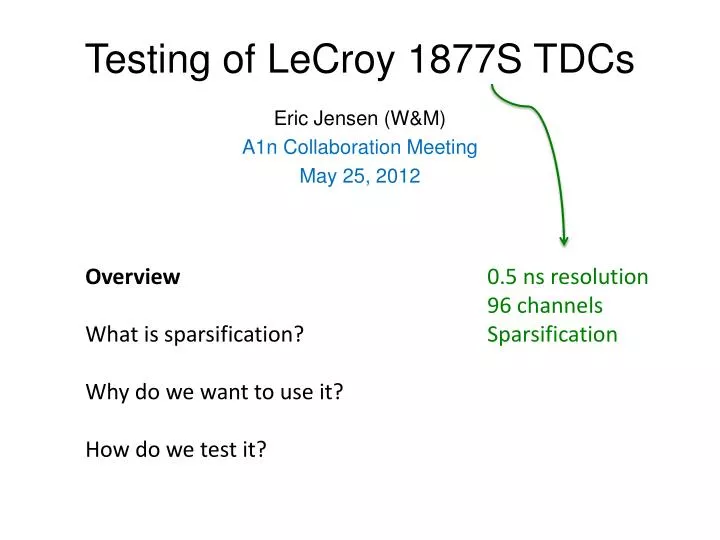
Testing of LeCroy 1877S TDCs Overview What is sparsification? Why do we want to use it? How do we test it? 0.5 ns resolution 96 channels Sparsification Eric Jensen (W&M) A1n Collaboration Meeting May 25, 2012
Sparsification 1877S TDC running in common stop mode withoutsparsification • Constantly accepting start signals • When STOP arrives it looks back the length of the full scale time window to find all signals inside of the window 1877S TDC running in common stop mode withsparsification • Still a full scale time window • Sparsification threshold which gives the TDC a time after which no new start signals should be recorded
Why Sparsification? • Considerable delay between start and stop pulses • Excess background leads to an increase in DAQ Dead Time • Recording large amounts of undesired data • Could install delay lines in all channels, but this is expensive • Use sparsification thresholds! Events of interest Full width = 1.5 μs BigBite TDC spectrum is just as bad! Region of interest is < 20% of total spectrum
A1n Delay between start and stop pulses requires a full scale time window of 1.5μs Projected event rate of 10 kHz FastBus data read rate achieves up to 40 Mb/sec Without sparsification the data rate will be > 40 Mb/sec With sparsification the data rate will be ≈ 5.6 Mb/sec (DT < 20%)
Test Setup Level Translator Pulser Discriminator Delay (300 ns) 1877S TDC V1495 L1A T1 (Back of the crate) FASTBUS crate COM
Readout Lists and Configurations Each TDC is tested with 3 different CRLs (CODA Readout Lists) Common stop from pulser is delayed by 325 ns 325 ns Sparsification CRL #1 Full scale time window = 400 ns Sparsification threshold = 0 ns Common stop Sparse. Thresh. 400 ns 0 ns 325 ns Sparsification CRL #2 Full scale time window = 400 ns Sparsification threshold = 300 ns Common stop Sparse. Thresh. 0 ns 400 ns 300 ns 325 ns Sparsification CRL #3 Full scale time window = 496 ns Sparsification threshold = 424 ns Common stop Sparse. Thresh. 0 ns 496 ns 424 ns
Results • The first 2 sparsification tests should provide each TDC channel with a sharp peak around 650 (325 ns) containing exactly 1000 events • A TDC channel is considered to be bad if it has: • Extra or missing events • An RMS value > 0.8 channels • A peak location outside of the range 640-660 channels • The TDC channels should see 0 hits for the 3rd test • A total of201TDCs have been fully tested, out of which23have bad channels
Summary • Enabling sparsification is a cost-free way of reducing the data flow • Allows A1n to achieve < 20% deadtime at an event rate of 10 kHz • Testing procedure developed, over 200 modules have been tested Thanks!