Download
1 / 25
250 likes | 359 Views
RICE PHYLOGENY REVISITED. N. K H I R I P E T AND V. POTLURI. Some Background. Rice is staple for more than half of the world’s population Large collection of germplasm [ >10000 accessions] held at IRRI Plant breeders/genecists use these to develop news cultivars

E N D
RICE PHYLOGENY REVISITED N. K H I R I P E TAND V. POTLURI
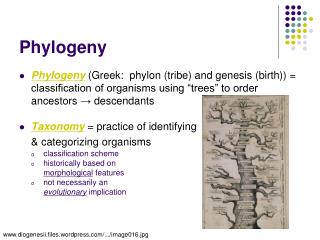
Some Background • Rice is staple for more than half of the world’s population • Large collection of germplasm [ >10000 accessions] held at IRRI • Plant breeders/genecists use these to develop news cultivars • For this purpose, evolutionary history/phylogeny is important
Rice genetics • Rice is usually a diploid, but tetraploids are not uncommon • The diploid genome is classified as • AA,BB,CC,DD,EE,FF,GG,HH.KK • The tetraploids are mostly allo • BBCC,CCDD,HHJJ,HHKK
Taxa in the Genus Oryza: the species and genome groups • Table 1-1. Taxa in the genus Oryza: the species and genome groups. [From IRRI] • Species2nGenomeDistribution • Sect. OryzaSer. Sativae • O. barthii 24 AA Sub-Saharan Africa • O. glaberrima 24 AA West Africa • O. glumaepatula 24 AA South, Central America • O. longistaminata 24 AA Sub-Saharan Africa • O. meridionalis 24 AA Tropical Australia • O. nivara 24 AA Tropical, Subtropical Asia • O. rufipogon 24 AA Tropical, Subtropical Asia, Tropical Australia • O. sativa 24 AA Worldwide • Ser. Latifoliae • O. eichingeri 24 CC South Asia, East Africa • O. alta 48 CCDD South, Central America • O. grandiglumis 48 CCDD South, Central America • O. latifolia 48 CCDD South, Central America • O. minuta 48 BBCC Philippines, Papua New Guinea • O. punctata 24, 48 BB, BBCC Sub-Saharan Africa • O. rhizomatis 24 CC Sri Lanka • O. officinalis 24,48 CC, BBCC Tropical, Subtropical Asia • Ser. Australienses • O. australiensis 24 EE ropical Australia • Sect. BrachyanthaSer. Brachyanthae • O. brachyantha 24 FF Sub-Saharan Africa • Sect. PadiaSer. Meyerianae • O. granulata 24 GG South, Southeast Asia • O. meyeriana 24 GG Southeast Asia • O. neocaledonica 24 ?? New Caledonia • Ser. Ridleyanae • O. longiglumis 48 HHJJ Indonesia (Irian Jaya), Papua New Guinea • O. ridleyi 48HHJJSoutheast Asia • Ser. Schlechterianae • O. schlechteri 48 HHKK Indonesia (Irian Jaya), Papua New Guinea
So, What is the Problem? • No problem really, but • We would like to have a better tool to understand the interrelationships of various cultivars • Which in turn should help breeders and genecists
Well then, what is the plan? • We chose four important enzymes, viz • Maturase • Integrase • Alcohol dehydrogenase I and • Alcohol dehydrogenase II
Then, • We got the protein sequence data [from NCBI]for these enzymes for 8 cultivars O. sativa 24 AA Worldwide • Ser. Latifoliae • O. eichingeri 24 CC South Asia, East Africa • O. alta 48 CCDD South, Central America • O. grandiglumis 48 CCDD South, C. America • O. latifolia 48 CCDD South, C.America • O. minuta 48 BBCC Philippines, PN G • O. punctata 24, 48 BB, BBCC Sub-Saharan Africa • O. rhizomatis 24 CC Sri Lanka
Hold On • Change of Speaker
Methods [contd.] • We constructed a phylogenetic tree for each enzyme using Workbench using Clustalw • We calculated the distance matrix from this tree using ClustalDist
[Methods-contd.] • We converted the distance matrix to digital form to be used in JBenzer and GDEusing PERL scripts. • Threshold • We used a median point between the distance values as a threshold. We will discuss the implications of changing the threshold after presenting the results
Finally [methods contd.] • We combined all the distance matrices and combined in to one matrix and • Digitized the matrix for use in JBenzer and GDE to obtain a single Benzer plot
Biology Workbench clustalw clustdist clustdist2benzer.pl sequences benzer2gde.pl
Clustdist2benzer.pl OL (1) 0.000 0.002 0.002 0.008 0.006 0.013 0.015 0.015 OG (2) 0.002 0.000 0.000 0.006 0.004 0.012 0.013 0.013 OA (3) 0.002 0.000 0.000 0.006 0.004 0.012 0.013 0.013 OE (4) 0.008 0.006 0.006 0.000 0.002 0.013 0.015 0.015 OR (5) 0.006 0.004 0.004 0.002 0.000 0.012 0.013 0.013 OS (6) 0.013 0.012 0.012 0.013 0.012 0.000 0.015 0.015 OP (7) 0.015 0.013 0.013 0.015 0.013 0.015 0.000 0.000 OM (8) 0.015 0.013 0.013 0.015 0.013 0.015 0.000 0.000 JBENZER 8 1,1,1,0,0,0,0,0,OL 1,1,1,0,1,0,0,0,OG 1,1,1,0,1,0,0,0,OA 0,0,0,1,1,0,0,0,OE 0,1,1,1,1,0,0,0,OR 0,0,0,0,0,1,0,0,OS 0,0,0,0,0,0,1,1,OP 0,0,0,0,0,0,1,1,OM
Benzer2gde.pl "OL","OG" "OL","OA" "OG","OL" "OG","OA" "OG","OR" "OA","OL" "OA","OG" "OA","OR" "OE","OR" "OR","OG" "OR","OA" "OR","OE" "OS","OS" "OP","OM" "OM","OP" JBENZER 8 1,1,1,0,0,0,0,0,OL 1,1,1,0,1,0,0,0,OG 1,1,1,0,1,0,0,0,OA 0,0,0,1,1,0,0,0,OE 0,1,1,1,1,0,0,0,OR 0,0,0,0,0,1,0,0,OS 0,0,0,0,0,0,1,1,OP 0,0,0,0,0,0,1,1,OM
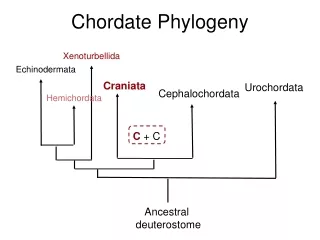
OL OG OA OE OR OS OP OM Maturase
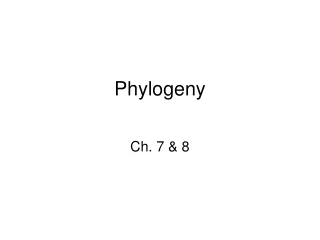
OA OG OL OS OP OE OR OM Integrase
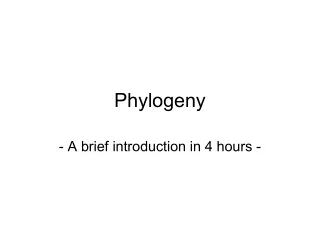
OP OA OG OS OR OE OL OM Alcohol dehydrogenase I
Alcohol dehydrogenase II OL OG OA OM OP OS OE OR
Conclusions • The phylogenetic trees and JBenzer differ in some respects • JBenjer plots show O.sativa [2n=24,AA]to be unique but in phylogenic trees,it is clustered with O.punctata [4x,48,BBCC] or O.grandiglumis and O.alta[4x,48,CCDD]
BUT • Remember the threshold values? • We used a median value from a matrix table and it does give relationships which can be related to their genomes. • IF we change the threshold value, the Benjer plot will change which brings the question whether relationships based on distance matrices need re-visitation
We realize that phylogenetic trees based on distance matrices have been used for so long • However, different scientists calculate and interpret the distance matrix results differently • Does it help if the input data is obtained differently from the beginning in binary format
We used a very limited data to compare but it does indicate that we may have to look at the phylogenetic relationships using improved methods to minimize and /or to understand better varied interpretations
Finally • A Gigabyte of Thanks to • ALL THE BIOQUEST STAFF AND THE PARTICIPANTS OF THIS WORKSHOP WHO MADE OUR PARTICIPATION IN THE WORKSHOP A MEMORABLE AND REWARDING EXPERIENCE