Download
1 / 32
330 likes | 516 Views
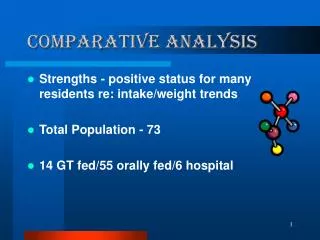
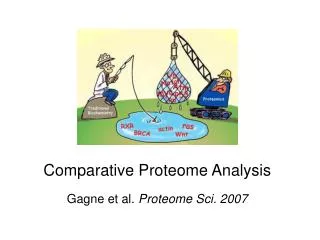
Lecture 6 Comparative analysis. Sample preparation. Protein mixture. Sample separation and visualisation Comparative analysis Digestion. Peptides. Mass spectrometry. MS data. Database search. Protein identification. General workflow for proteomic analysis. Sample. Data analysis.

E N D
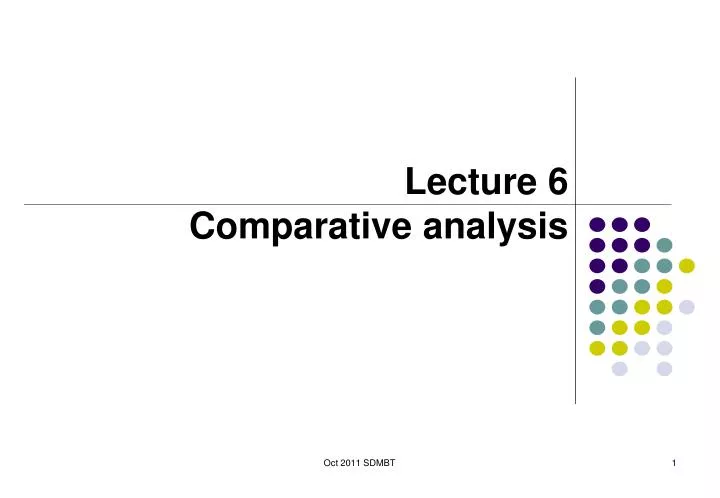
Lecture 6 Comparative analysis Oct 2011 SDMBT
Sample preparation Protein mixture Sample separationand visualisation Comparative analysis Digestion Peptides Mass spectrometry MS data Database search Protein identification General workflow for proteomic analysis Sample Oct 2011 SDMBT
Data analysis Sequence of events for comparative analysis Scanning of image Image processing Spot Detection Gel Matching Oct 2011 SDMBT
Scanning of image • Convert ‘analog’ spots on gel into digital data • High resolution images on densitometers/imaging systems • For wet or dried gels that have been stained, X-ray films and blots Oct 2011 SDMBT (Biorad, Biosurplus.com, Institute of Arctic Biology)
Densitometry (Proteomic Identification of 14-3-3ζ as an Adapter for IGF-1 and Akt/GSK-3β Signaling and Survival of Renal Mesangial Cells, Singh et al., Int J Biol Sci 2007; 3:27-39 ) (UIC) Oct 2011 SDMBT
Densitometry Oct 2011 SDMBT
Image Processing • Digital data converted into Gaussian curves. • Algorithms used to smoothen curve, removing statistical noise • Contrast enhancement to see better spots • Background subtraction to remove meaningless changes in the background of the gel Oct 2011 SDMBT
Smoothing Gaussian curves Raw data curve #1 curve #2 (CBU Imaging Wiki) Oct 2011 SDMBT (BARS,Statlib)
Contrast enhancement (brneurosci.org) Oct 2011 SDMBT
Background subtraction (NIH Image) Oct 2011 SDMBT
Image Processing (Olympus) Oct 2011 SDMBT
Contrast enhancement (Olympus) Oct 2011 SDMBT
Smoothing (Olympus) Oct 2011 SDMBT
Background subtraction (Olympus) Oct 2011 SDMBT
Spot detection • Automatic detection aided by manual input • Need to adjust sensitivity • Too little sensitivity = missed spots • Too much sensitivity = false positives Oct 2011 SDMBT (Biorad)
Spot detection Streaks Overlapping spots Oct 2011 SDMBT (Biorad)
Gel Matching • Compare identical spots on different gels • Matching is seldom 100% due to variations in experimental techniques (staining, gel preparation) • Use of landmarks to improve matching • Most time-consuming step (Proteomics – from protein sequence to function, Pennington & Dunn [editors]) Oct 2011 SDMBT
Gel Matching Oct 2011 SDMBT (Biorad)
Manual spot matching Matched Unmatched (Biorad) Oct 2011 SDMBT
Data Analysis • After matching, data are arranged into a table • Subjected to normalisation to account for inconsistencies in staining and gel preparation • Normalise by: • Total gel intensity • Total intensity of subset of spots (Proteomics – from protein sequence to function, Pennington & Dunn [editors]) Oct 2011 SDMBT
Data Analysis (Biorad) Oct 2011 SDMBT
e.g. with CyDye (GE Bioscience) Oct 2011 SDMBT
Internal standard to make sure that abundance is normalised and variation Is due to biological variation rather than gel-to-gel variation Oct 2011 SDMBT
Lecture 7 In-gel digestion Oct 2011 SDMBT
Sample preparation Protein mixture Sample separationand visualisation Comparative analysis Digestion Peptides Mass spectrometry MS data Database search Protein identification General workflow for proteomic analysis Sample Oct 2011 SDMBT
Rationale for digestion of proteins • Error is proportional to mass of the protein • PTMs further complicate assignments based on mass • Sensitivity of MS measurement increases with the use of smaller peptides (6-20 amino acids) • Proteases are able to cut at specific amino acid residues Oct 2011 SDMBT
Trypsin Arginine or Lysine Proline (ExPasy PeptideCutter) Oct 2011 SDMBT
Chymotrypsin Leucine, Methionine and Histidine (minor) Tryptophan, Tyrosine and Phenylalanine (major) Proline (ExPasy PeptideCutter) Oct 2011 SDMBT
Peptide masses from tryptic digest Peptide Cutter (Mass Spectrometric Sequencing of Proteins from Silver-Stained Polyacrylamide Gels, Shevchenko et al., Anal. Chem. 1996, 68, 850-858) Oct 2011 SDMBT
Typical protocol for in-gel digestion • Excision of Commassie stained spot(s) from gel(s) • Destaining with NH4HCO3 /acetonitrile • Reduction with DTT • Alkylation with IAA Oct 2011 SDMBT
Overview of in-gel digestion • Absorption of minimal amount of trypsin into gel (on ice) • Overnight incubation of trypsin at 37ºC • Extraction of peptides from gel with 5% formic acid in NH4HCO3 /acetonitrile, or trifluoroacetic acid • Clean up by ZipTips (removes ionic salts) Oct 2011 SDMBT