Download
1 / 54
540 likes | 748 Views
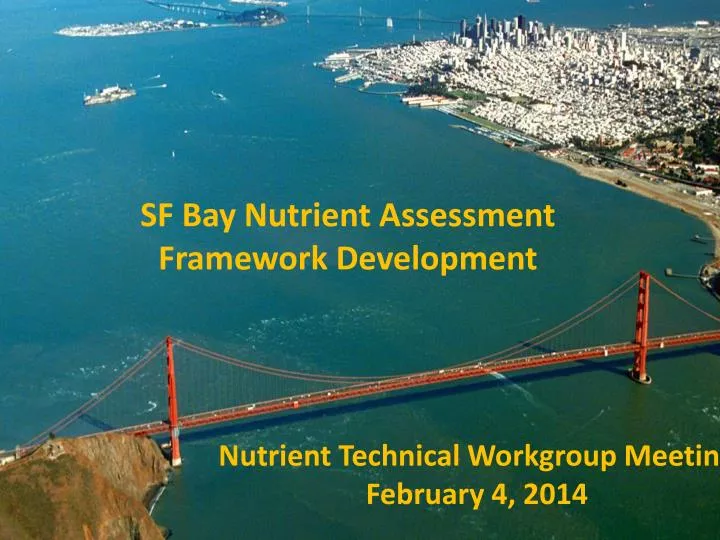
SF Bay Nutrient Assessment Framework Development. Nutrient Technical Workgroup Meeting February 4, 2014. At Previous Stakeholder Meetings…. Discussed work plan to create assessment framework Presented white paper summarizing existing approaches to creating assessment frameworks

E N D
SF Bay Nutrient Assessment Framework Development • Nutrient Technical Workgroup Meeting • February 4, 2014
At Previous Stakeholder Meetings…. • Discussed work plan to create assessment framework • Presented white paper summarizing existing approaches to creating assessment frameworks • Site-specific (Chesapeake Bay chlorophyll a criteria) • Regional (Florida, European Water Framework Directive) Specific Feedback from SAG: • Opportunity to provide technical input in real time, not just comment on outcome
Progress Since Last Meeting • Completed preliminary analysis of existing data • Held 2nd conference call of expert team to discuss: • Proposed segmentation • Get consensus on indicators • Present analysis of existing data • First workshop is scheduled for February 11-12, 2014 • Tech team is working on the charge
Goal and Roadmap for This Agenda Item Goal: Provide opportunity for SAG technical input on approach prior to for technical team workshop Road map: • Overview of process, approach and timeframe • Geographic scope, focal habitats, and proposed segmentation • Informing the process: analysis of existing data • Charge for February 11-12, 2014 workshop • Discussion (all)
Context for Assessment Framework Conceptual Model Assessment Framework Modeling Strategy Nutrient-Response Model Development and Validation SF Bay Monitoring Program Core Monitoring and Special Studies Regulatory NPS Control Waterbody Assessments and 303(d) listing Basin Plan Objectives NPDES Permit Limits
What is An Assessment Framework? • Decision support • Transparent • Peer-reviewed • Capacity to evolve framework as science advances • Indicators, metrics & endpoints may differ by Bay segment or season • Key components • Supported by SF Bay conceptual models • Specifies what to measure, temporal and spatial frequency in which those indicators/metrics should be measured • Specifies how to use data to classify the Bay (or segments of the Bay) in “risk categories” • Assessment frameworks do not: • Specify regulatory thresholds – that is a policy decision
Process and Schedule to Develop Assessment Framework • Begin with conceptual models • Identify indicators, linkages to beneficial uses at relevant spatial and temporal scales • Review available assessment frameworks • White paper that synthesizes approaches, data required • Utilize those frameworks with existing SF Bay data (if available) to demonstrate applicability • Inform decision-making • Utilize demo results, in tandem with conceptual models, to craft strawman framework with experts • Demonstrate with existing data • Vete and refine assessment framework (…repeat) Fall 2012 Spring 2013 Fall 2013 Spring 2014 Summer 2014
Who Are The Experts • International experts in assessment frameworks, criteria: • Suzanne Bricker (NOAA) • Larry Harding (University of Maryland/UCLA) • James Hagy (EPA ORD) • Local experts in SF Bay nutrient biogeochemistry and eutrophication, but not limited to: • Jim Cloern -- Wim Kimmerer • AnkeMueller-Solger • Dick Dugdale • Raphael Kudela
What’s Ahead: Three 2-Day Experts Workshops To Develop Draft Framework • Workshop 1 (January-February 2014) • Confirm indicators (and metrics) of interest • Agree on geographic scope, SF Bay “segments” and targeted habitats • Identify temporal elements of assessment framework • Identify spatial elements of assessment framework • Workshop 2 (March- April 2014) • Develop proto-monitoring program • Discussion of thresholds for classification scheme • Workshop 3 (May-June 2014) • Develop classification scheme by Bay segment • Discuss uncertainty associated with classification scheme • Conference calls (June – July 2014) • Comment on assessment framework document
Goal and Roadmap for This Agenda Item Goal: Provide opportunity for SAG technical input on approach prior to for technical team workshop Road map: • Overview of process, approach and timeframe • Geographic scope, focal habitats, and proposed segmentation • Informing the process: analysis of existing data • Charge for February 11-12, 2014 workshop • Discussion (all)
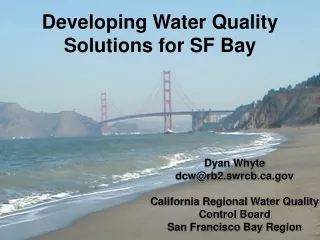
Geographic Scope and Applicable Habitats? • Geographic scope coincident with RB 2 boundaries • Shallow & deepwater subtidal • Excludes: • Diked baylands, restored salt ponds
Proposed Preliminary Segmentation of SF Bay, Based on Jassby et al. 1997 • Boundaries coincident with natural physical boundaries • Starting point for discussions now • Possibility to refine with new data
Analysis of Existing Monitoring Data:A Preview From January 16, 2014 Tech Team Conference Call
Introduction • Many frameworks exist to assess effects of nutrient over-enrichment and/or eutrophication • Use of different assessment frameworks on same system can yield very different results • Different frameworks apply similar indicators, but small differences affect outcome • Data integration (seasonal, annual average, annual median, percentile) • Characteristics included in indicator metrics (concentration, spatial coverage, frequency of occurrence) • Combination of indicators into multiple lines of evidence
Purpose of Analysis of Existing Data Inform the process of developing an appropriate assessment framework and monitoring program for SF Bay • Test out existing indicators and assessment frameworks using real data • Show you how the details of indicators, thresholds, and data integration affect the result • Generate discussion of what you like/don’t like about the frameworks • Solicit additional analysis that could be done to better inform this process This is a jumping off point for discussion, so looking for a visceral reaction! Does not imply we are suggesting to use these approaches for SF Bay
Data Sets– Quarterly Sampling • USGS Water Quality Monitoring Surveys • Chlorophyll (1975-present) • Dissolved oxygen (1971-present) • Inorganic nutrients (1971-present) • Interagency Ecological Program (IEP) Bay –Delta monitoring program (CA Department of Water Resources) • Chlorophyll (1975-present) • Taxa (1975-present) • Dissolved oxygen (1971-present) • Inorganic nutrients (1971-present) • Total nutrients (1971-present) • Turbidity (1975-present)
Conceptual Basis for Frameworks- Linkage to Management Endpoints • Light limitation on seagrass • Unbalanced algal community composition/structure and potential foodweb effects • Over-production of organic matter (implications for hypoxia, benthic habitat quality, altered nutrient cycling)
What Would the Bay Look Like if It Had A Problem From Nutrient Overenrichment- From Senn et al. (2013)
Dissolved Oxygen (DO) 2 R From L. W. Harding et al. 2013. Scientific bases for numerical chlorophyll criteria in Chesapeake Bay. Estuaries and Coasts doi:10.1007/s12237-013-9656-6
Submerged Aquatic Vegetation (SAV) From L. W. Harding et al. 2013. Scientific bases for numerical chlorophyll criteria in Chesapeake Bay. Estuaries and Coasts doi:10.1007/s12237-013-9656-6
HABs – Microcystis spp. From L. W. Harding et al. 2013. Scientific bases for numerical chlorophyll criteria in Chesapeake Bay. Estuaries and Coasts doi:10.1007/s12237-013-9656-6
Evaluated Frameworks • Water Framework Directive (developed in United Kingdom) • Water quality index • Phytoplankton index • Taxa index • Assessment of Estuarine Trophic Status (ASSETS) • Chlorophyll • Dissolved oxygen • The French Research Institute for the Exploration of the Sea (IFREMER) Classification for Mediterranean Lagoons
Why These Three? These three frameworks differ sufficiently in approach, results demonstrate how organizing principles affect outcome.
Indicators: ASSETS Classification is assessed using a multi metric approach For this analysis; indicators for chlorophyll a and dissolved oxygen were assessed independently
Indicators: IFREMER Classification is assessed using a series of indicators and thresholds
Indicators: UK-WFD Phytoplankton Each statistic is given a point value of 1 if it does not exceed the threshold, the sum of points accumulated yields the final classification.
Indicators: UK-WFD Taxa Classification is assessed as the sum of a series of exceedences
Indicators: UK-WFD Water Quality Index Classification is assessed via progression through three indices * For this exercise, potential primary production was calculated using DIN rather than loads, because loads are unavailable
Analysis of Existing Data Approach • Assess eutrophic condition for SF Bay and its segments • Compare results between indicators • Compare outcomes based on data integration • Inter-annual variability (yearly, six year running average) • Temporal integration of annual data (seasonal, annual average, annual median, percentile) • Spatial integration
Preliminary Segmentation of the Bay Habitat types of SFB and surrounding Baylands. Water Board subembayments boundaries are shown in black. Habitat data from CA State Lands Commission, USGS, UFWS, US NASA and local experts were compiled by SFEI.
Preliminary Bay Segments • Sub-estuaries: North Bay, South Bay, Delta • Sub-basins: Suisun, San Pablo, Upper South Bay, Lower South Bay
Understanding the Effects of Data Integration on Outcome • Use North Bay as a test case • Two different datasets allow • Compare results between indicators • Focus primarily on chlorophyll • Compare outcomes based on varying data integration methods • Inter-annual variability (yearly, six year running average) • Temporal integration of annual data (seasonal, annual average, annual median, percentile) • Spatial integration
North Bay: Incorporation of Inter-Annual Variability Yearly Data Six Year Running Average
North Bay:Differences in Spatial Sampling Sampling in Main Channel and Shallower Waters Sampling in Main Channel Only DWR Only USGS Only
North Bay: Defining the Averaging Period • Growing Season? • Annual Average, Median Value, Percentile Monthly average chl-a (mg m-3) – 2006-2011 20 20 Suisun San Pablo 15 15 10 10 5 5 0 0 O J S M A M F D J A N J O J S M A M F D J A N J Data source: http://sfbay.wr.usgs.gov/access/wqdata/
North Bay: Effect of Statistic and Threshold ASSETS Thresholds IFREMER Thresholds • ASSETS Thresholds
North Bay: Effect of Statistic and Threshold WFD 95% < 50 ug/L = 1 point ASSETS 90% > 60, 20, 5 ug/L WFD 85% < 20 ug/L = 1 point WFD 75% < 10 ug/L = 1 point
Take Home Messages- Preliminary Analysis of Existing Data • Finite set of indictors considered • Phytoplankton biomass and/or productivity • Phytoplankton assemblage, harmful algal blooms • Nutrients, when employed, are secondary • Convergence on thresholds • Differences in spatial and temporal statistic used for data interpretation matter!
Outcome of Discussion on Analysis of Existing Data • Discussion on indicators and metrics • Suggestions for additional analysis of existing data
Discussion on Indicators and Metrics • Phytoplankton biomass and productivity • Phytoplankton assemblage • HAB species abundance and toxin concentration • Affirmed that nutrient forms and ratios would be monitoring but not considered upfront • Minority dissent
Suggestion for Additional Analysis of Existing Data • Refine previous analyses, using new segmentation boundaries per Jassby et al. (1997) • New indicator for productivity • Suggestions for additional datasets to be included in the analyses • 1989 Ota et al. USGS open file report has detailed spatial data of SF Bay. Rerun analysis to show comparison of shallow and deepwater stations • With R. Kudela, redefine metric applicable to phytoplankton assemblage or HAB species cell count (biovolume) and/or toxin concentrations. • Provide graphic of climate context for time series • Locate 1970s Ball and Arthur data set that featured large blooms in Suisun Bay associated with low DO
Prospective Indicator:Gross Primary Production Modeled for each data point from existing dataset following Cloern et al. 2007: GPP = 3.77 (CHLa * I0)/k k estimated from suspended particulate matter (SPM) k= 0.567 + 0.0586 * SPM I0 estimated by day from average irradiance profile fit to a fourth order polynomial All points in each segment were averaged to generate an annual average GPP y = 4E-08x4 - 2E-05x3 + 0.0042x2 + 0.0646x + 14.093R² = 0.9831
Spatial Analysis • 1980 USGS dataset with sampling along channel and across channel transects • South Bay, San Pablo Bay, Suisun Bay • Compare main channel chlorophyll and GPP with same analyses in shallower sites in same basin • Use measurements at 2m in main channel and 1m in shallows
Basin Average Chlorophyll in Deep Main Channel Vs. Shallow Water Survey