Download
1 / 1
10 likes | 130 Views
Ocean Transition Layer Thickness and Mixed Layer Depth Jun Dong, Kevin Speer GFDI, Department of Oceanography, Florida State University. Abstract

E N D
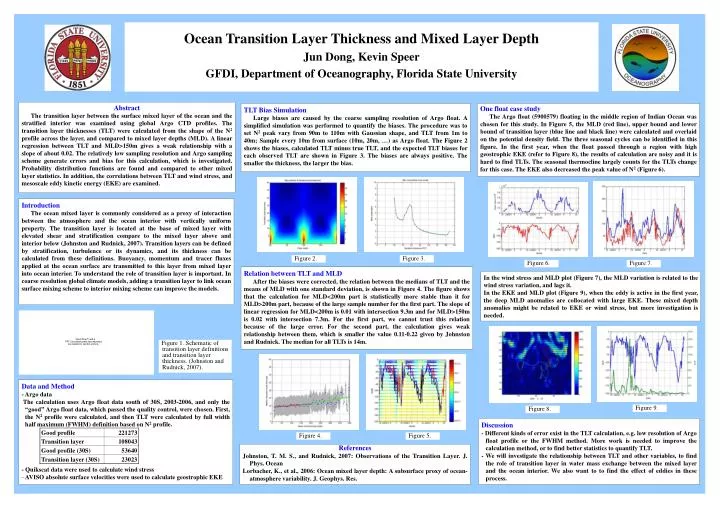
Ocean Transition Layer Thickness and Mixed Layer Depth Jun Dong, Kevin Speer GFDI, Department of Oceanography, Florida State University Abstract The transition layer between the surface mixed layer of the ocean and the stratified interior was examined using global Argo CTD profiles. The transition layer thicknesses (TLT) were calculated from the shape of the N2 profile across the layer, and compared to mixed layer depths (MLD). A linear regression between TLT and MLD>150m gives a weak relationship with a slope of about 0.02. The relatively low sampling resolution and Argo sampling scheme generate errors and bias for this calculation, which is investigated. Probability distribution functions are found and compared to other mixed layer statistics. In addition, the correlations between TLT and wind stress, and mesoscale eddy kinetic energy (EKE) are examined. TLT Bias Simulation Large biases are caused by the coarse sampling resolution of Argo float. A simplified simulation was performed to quantify the biases. The procedure was to set N2 peak vary from 90m to 110m with Gaussian shape, and TLT from 1m to 40m; Sample every 10m from surface (10m, 20m, …) as Argo float. The Figure 2 shows the biases, calculated TLT minus true TLT, and the expected TLT biases for each observed TLT are shown in Figure 3. The biases are always positive. The smaller the thickness, the larger the bias. One float case study The Argo float (5900579) floating in the middle region of Indian Ocean was chosen for this study. In Figure 5, the MLD (red line), upper bound and lower bound of transition layer (blue line and black line) were calculated and overlaid on the potential density field. The three seasonal cycles can be identified in this figure. In the first year, when the float passed through a region with high geostrophic EKE (refer to Figure 8), the results of calculation are noisy and it is hard to find TLTs. The seasonal thermocline largely counts for the TLTs change for this case. The EKE also decreased the peak value of N2 (Figure 6). Introduction The ocean mixed layer is commonly considered as a proxy of interaction between the atmosphere and the ocean interior with vertically uniform property. The transition layer is located at the base of mixed layer with elevated shear and stratification compare to the mixed layer above and interior below (Johnston and Rudnick, 2007). Transition layers can be defined by stratification, turbulence or its dynamics, and its thickness can be calculated from these definitions. Buoyancy, momentum and tracer fluxes applied at the ocean surface are transmitted to this layer from mixed layer into ocean interior. To understand the role of transition layer is important. In coarse resolution global climate models, adding a transition layer to link ocean surface mixing scheme to interior mixing scheme can improve the models. Figure 2. Figure 3. Figure 6. Figure 7. Relation between TLT and MLD After the biases were corrected, the relation between the medians of TLT and the means of MLD with one standard deviation, is shown in Figure 4. The figure shows that the calculation for MLD<200m part is statistically more stable than it for MLD>200m part, because of the large sample number for the first part. The slope of linear regression for MLD<200m is 0.01 with intersection 9.3m and for MLD>150m is 0.02 with intersection 7.3m. For the first part, we cannot trust this relation because of the large error. For the second part, the calculation gives weak relationship between them, which is smaller the value 0.11-0.22 given by Johnston and Rudnick. The median for all TLTs is 14m. In the wind stress and MLD plot (Figure 7), the MLD variation is related to the wind stress variation, and lags it. In the EKE and MLD plot (Figure 9), when the eddy is active in the first year, the deep MLD anomalies are collocated with large EKE. These mixed depth anomalies might be related to EKE or wind stress, but more investigation is needed. Figure 1. Schematic of transition layer definitions and transition layer thickness. (Johnston and Rudnick, 2007). • Data and Method • - Argo data • The calculation uses Argo float data south of 30S, 2003-2006, and only the “good” Argo float data, which passed the quality control, were chosen. First, the N2 profile were calculated, and then TLT were calculated by full width half maximum (FWHM) definition based on N2 profile. • - Quikscat data were used to calculate wind stress • AVISO absolute surface velocities were used to calculate geostrophic EKE Figure 9. Figure 8. Discussion - Different kinds of error exist in the TLT calculation, e.g. low resolution of Argo float profile or the FWHM method. More work is needed to improve the calculation method, or to find better statistics to quantify TLT. - We will investigate the relationship between TLT and other variables, to find the role of transition layer in water mass exchange between the mixed layer and the ocean interior. We also want to to find the effect of eddies in these process. Figure 4. Figure 5. References Johnston, T. M. S., and Rudnick, 2007: Observations of the Transition Layer. J. Phys. Ocean Lorbacher, K., et al., 2006: Ocean mixed layer depth: A subsurface proxy of ocean-atmosphere variability. J. Geophys. Res.