Download
1 / 9
110 likes | 324 Views
Plots of Fluid Flow Data. • Profile plots- A profile plot indicates how the value of a scalar (or vector can be plotted but only the magnitude) property varies along some desired direction in the flow field (pressure, temperature and density).

E N D
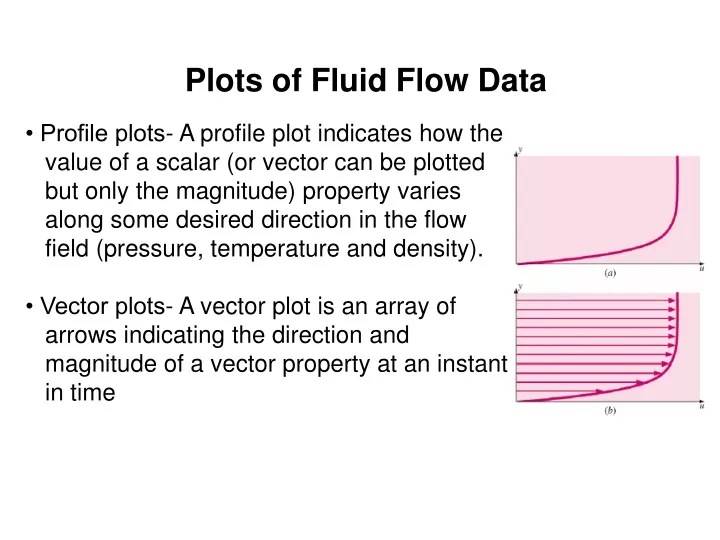
Plots of Fluid Flow Data • Profile plots- A profile plot indicates how the value of a scalar (or vector can be plotted but only the magnitude) property varies along some desired direction in the flow field (pressure, temperature and density). • Vector plots- A vector plot is an array of arrows indicating the direction and magnitude of a vector property at an instant in time
Vector Plots 2- dimensional flow field ; turbulent and unsteady, Long time average is plotted. a) Streamlines, b) velocity vector, close up view of the separated flow region
Contour Plots Pressure is highest at thefront face A contour plot shows curves of constant values of a scalar property or magnitude of a vector property at an instant in time. Isocontour plots are generated for pressure, temperature, velocity magnitude, species concentration, properties of turbulence etc. Contour line-simple curves indicating various levels of the property Filled contour plot- filled with different colors.
Types of Motion • a) Translation • b) Rotation • c) Extensional strain (linear strain) • d) Shear Strain • Velocity= rate of translation • Angular velocity =rate of rotation • Linear strain rate • Shear strain rate
Vorticity and Rotationality Vorticity is a measure of rotation of a fluid particle and is equal to twice the angular velocity of a fluid particle. Rotation of fluid elements is associated with wakes, boundary layers, flow through turbomachinery (fans, turbines, compressors etc.) and flow with heat transfer. The vorticity of a fluid element can not change except through the action of viscosity, non-uniform heating (temperature gradient)
Vorticity For a two-dimensional flow in the xy-plane, the vorticity vector always points in the z or –z direction. In this illustration, the flag-shaped fluid particle rotates in the counterclockwise direction as it moves in the xy-plane; its vorticity points in the positive z- direction as shown. Contour plot of the vorticity field ζz due to flow impinging on a block, as produced by CFD calculations; only the upper half is shown due to symmetry. Dark regions represent large negative vorticity, and light regions represent large positive vorticity.
Reynolds Transport Theorem (RTT) • In thermodynamics and solid mechanics we often work with a system (also called a closed system), defined as a quantity of matter of fixed identity. • In fluid dynamics, it is more common to work with a control volume (also called an open system), defined as a region in space chosen for study. • The size and shape of a system may change during a process, but no mass crosses its boundaries. • A control volume, on the other hand, allows mass to flow in or out across its boundaries, which are called the control surface. • A control volume may also move and deform during a process, but many real world applications involve fixed, non-deformable control volumes.
System vs Control Volume Two methods of analyzing the spraying of deodorant from a spray can: (a) We follow the fluid as it moves and deforms. This is the system approach—no mass crosses the boundary, and the total mass of the system remains fixed. (b) We consider a fixed interior volume of the can. This is the control volume approach—mass crosses the boundary.
(RTT) • Most principles of fluid mechanics are adopted from solid mechanics, where the physical laws dealing with the time rates of change of extensive properties are expressed for systems. • In fluid mechanics, it is usually more convenient to work with control volumes, and thus there is a need to relate the changes in a control volume to the changes in a system. • The relationship between the time rates of change of an extensive property for a system and for a control volume is expressed by the Reynolds transport theorem (RTT), which provides the link between the system and control volume • RTT is named after the English engineer, Osborne Reynolds (1842–1912), who did much to advance its application in fluid mechanics.