Download
1 / 33
330 likes | 454 Views
Quantitative Methods. Student Presentations 1. Analysing data collected in class – FEEDBACK SESSION Instructions: State Hypotheses and whether or not they are directional or non direction, IN ENGLISH!

E N D
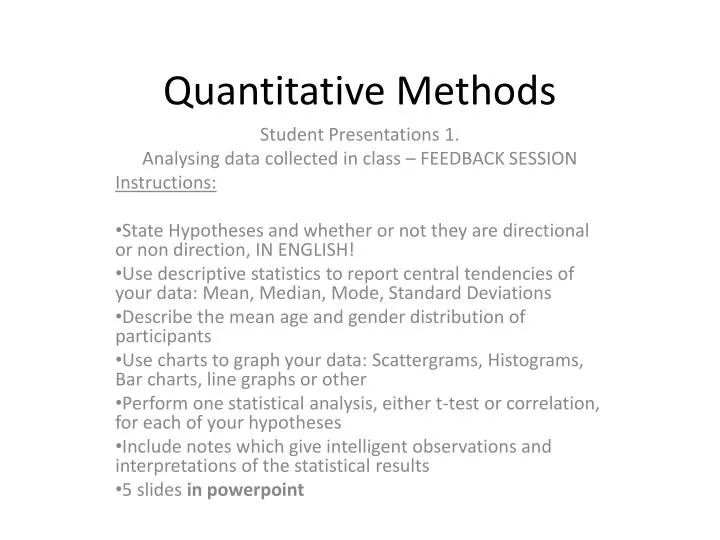
Quantitative Methods Student Presentations 1. Analysing data collected in class – FEEDBACK SESSION Instructions: State Hypotheses and whether or not they are directional or non direction, IN ENGLISH! Use descriptive statistics to report central tendencies of your data: Mean, Median, Mode, Standard Deviations Describe the mean age and gender distribution of participants Use charts to graph your data: Scattergrams, Histograms, Bar charts, line graphs or other Perform one statistical analysis, either t-test or correlation, for each of your hypotheses Include notes which give intelligent observations and interpretations of the statistical results 5 slides in powerpoint
What’s the learning objective? • To repeat the statistical tests learned in class and go through the steps for obtaining results without your teaching holding your hand! • To learn how to organise your data and graph your results • To have a simple presentation which doesn’t require much time to prepare so you can spend most of your 10 hours independent work for this course practising and familiarising yourself with SPSS and the tests we have covered in class
What should I do if I get stuck? • If you are stuck remember what the task is, check the blog • If you are stuck remembering which menus to use in SPSS, consult your textbook ‘SPSS for dummies’ • If you are stuck remembering what the various measures of central tendency are, what correlations are, which correlation to use, what t tests are, which t test to use, consult the cartoon guide to statistics • If you try all these things and you still can’t figure it out independently, ask your teacher!
5 slides prepared by groups of 5 as the assignment for the week! • Groups were 5 or 6 people • You are supposed to spend 10 hours per week doing HOMEWORK for this class • This means a total of 50 to 60 combined working hours for 5 slides!!! • 10 hours per slide!!! • Did your work represent that much work?
Feedback • This is not in English • There is no interpretation of results • Hypotheses are not stated • Minor point – this was not a powerpoint presentation! Means I have to convert..... • There is no description of participants
Feedback • Hypothesis correctly stated • Central Tendencies correctly reported • Statistical analysis attempted • Intelligent comments on the results • Problems encountered clearly stated • Good effort!
Feedback • The title page does not constitute one of the slides for your analysis! • No comments or interpretation of results • No statement of Hypotheses • Confusion regarding bias! • “t-test?” does NOT constitute a statement of what difficulties were encountered! • Variables were not listed in English
Hypotheses:People who have been away from the education system for a long period, tend to get lower grades then people who have been away for a short period. Our data
The two graph shows that our hypothesis is incorrect. • The graph shows that people that have been away for 3 months get the lowest average • grade, while people who have been away for 24 months get the highest average grade. • If our hypothesis should be correct, the dots should have been following the red line.
Problems: • Range: ? • Korrelation: ? • Std. Deviation: ?
Feedback • T test incorrectly reported • Central tendencies not completely reported • Incorrect interpretation of graph – in fact it suggests that there is no relationship • Incorrect statistical analysis; your hypothesis suggests a correlation • Nonetheless, at least some evidence of effort